

Covid Situation Report: Sep 5, 2024
Covid Situation Report: Sep 5, 2024
Update on Covid providing information on prevalence and hospital admissions for England and its regions. This post is best viewed using the browser or Substack app.

Introduction.
This report is part of a weekly series that summarises the Covid situation in England and its regions.
A reminder that not all of the data previously included in the situation update is now available on a weekly basis. Where relevant, changes to the content and data sources have been noted.
This week the data published for England covers only case rates from the UKHSA Covid dashboard. The latest available data for Scotland, Wales and Northern Ireland is provided together with the key points from the recent NHS statement on the Autumn 2024 Booster Vaccination. Finally, there is a short update on Covid deaths in England and Wales.
Summary.
Recent data for England, Scotland, Wales, and Northern Ireland show that Covid levels are now stabilising at relatively low levels indicating the end of the latest wave.
Over the past week, daily case rates in England have plateaued at low levels, signalling the summer wave is likely over. Although case rates are stable in most regions there are early signs of increases in some northern regions.
In Scotland, hospital admissions and the number of beds occupied by Covid patients have also stopped falling and have now plateaued at relatively low levels.
In Wales the Covid cases and hospital admissions levels have also stopped falling but are at relatively low levels.
Northern Ireland is experiencing a similar trend, with hospital admissions for community-acquired Covid falling from the latest peak although levels have plateaued over the past three weeks.
The NHS have reconfirmed the eligibility criteria for the Autumn 2024 booster campaign which will start on October 3, 2024.
Deaths due to Covid in England and Wales have continued to decline and have returned to levels below those seen at the same period lest year.
Although the data indicates that this recent wave is over, this is an important reminder that Covid is not presently a seasonal disease and may never become one. As such, we should anticipate potential future waves with the emergence of new variants, diminishing immunity levels, and increased mixing as we enter the autumn months.
As always, it’s important to remember that the risk of hospitalisation from Covid infection increases significantly with age and for those immunocompromised. Also Long Covid remains a risk for all as shown by the recent ONS report. Therefore, it is prudent to take appropriate measures such as self-isolating when experiencing Covid symptoms and enhancing ventilation or wearing masks whenever possible.
Status of main respiratory diseases in England.
The UKHSA National influenza and COVID-19 surveillance report has moved to a condensed summer report and is now released every two weeks. Consequently, there is no updated information on Covid test positivity or weekly hospital admissions available to report. The next update will be published on Thursday, Sep 12 2024.
Covid case rates in England
The UKHSA Covid dashboard continues to publish daily case rates for England on a weekly basis. As the majority of testing now occurs in hospitals or under medical supervision, these rates should closely align with hospital admissions. However, a comparison of daily case rates and daily admissions shows that this is not the case.
Appendix 1 indicates that although Covid case rates typically reflect the pattern of hospital admissions, there is a notable discrepancy in the magnitude of changes, with admissions experiencing a more pronounced fluctuation than case rates. Therefore, while case rates are helpful in signalling the general trend of Covid within the population, they do not precisely represent the degree of change.
The first chart in this section shows daily case rate per 100,000 individuals.
The chart indicates that Covid case rates have peaked and fallen for the past seven weeks indicating that the ‘summer’ wave is over. Current case rates are now lowers than those observed during the peak in May. It is important to note, as detailed above and in Appendix 1, that comparisons with the peak in Winter 2023 are not recommended.
The next panel chart in this section shows Covid rates for the regions of England. Hover your cursor over one of the chart lines to display the admission rates for all regions.
The panel charts indicate that following the recent decline, daily case rates are now stabilising at relatively low levels across most regions. However, there are early signs of an increase in the North East and Yorkshire and Humberside regions.
Daily Covid hospital admissions and bed occupancy.
This section gives a more detailed examination of the most recent daily Covid data for hospitals in England.
NHS England stopped the weekly publication of data used to create these dashboards from April 4, 2024 and have moved to a monthly publication schedule. The next update will be available on September 12, 2024 covering August data.
Scotland weekly hospital admissions and bed occupancy
Scotland continues to publish weekly data on hospital admissions and bed occupancy for Covid as well as waste water monitoring data. The dashboard for Scotland’s data can be accessed here.
The following panel chart shows the most recent data for weekly Covid hospital admissions up to Aug 25, depicted in blue, together with the number of beds occupied by Covid patients up to Sep 1, shown in orange. The number of occupied beds represent patients being treated for Covid as well as those being treated with Covid.
The charts show that the recent summer Covid wave in Scotland led to more hospital admissions and a greater number of beds occupied by Covid patients compared to the 'winter' wave. Nevertheless, there has been a marked decrease in both admissions and bed occupancy since the peak in summer, even though the figures have stabilised in the latest week.
Wastewater data reporting is currently paused until the end of September as the responsibility for laboratory Covid water samples testing transfers from Scottish Environment Protection Agency (SEPA) to NHS Lothian.
Wales Covid cases and hospital admissions.
Public Health Wales publishes a weekly Covid dashboard, presenting key Covid hospital indicators for the preceding 90 days. This dashboard can be found here. Additionally, data regarding Covid cases detected through testing in hospitals and other medical facilities are released every week.
The following charts shows the latest data for the weekly (7 day rolling sum) number of cases reported.
While the weekly cases have plateaued in the most recent week, there has been a notable decline over the past eight weeks indicating that the summer wave is over. This fall follows a surge in cases over the summer that surpassed the 'winter' wave, reaching the highest point in over a year.
The following chart gives the trend for weekly hospital admissions in Wales.
Hospital admissions for Covid increased in June, but have now fallen significantly for the past eight weeks, mirroring the trend observed in Covid cases, and confirming that the ‘summer’ wave is over.
Northern Ireland hospital admissions
Public Health Northern Ireland publishes a weekly COVID-19 Epidemiological Bulletin that provides data on Covid cases, hospital admissions and occupancy and care home incidents. The full report, published every Thursday, can be found here.
The chart below presents the weekly count of Covid hospital admissions for cases where the infection was contracted in the community, thereby excluding patients who contracted Covid while in hospital. It is important to note that the hospital admissions data for other home nations include patients who contracted infections in the hospital, making them not directly comparable to the data from Northern Ireland.
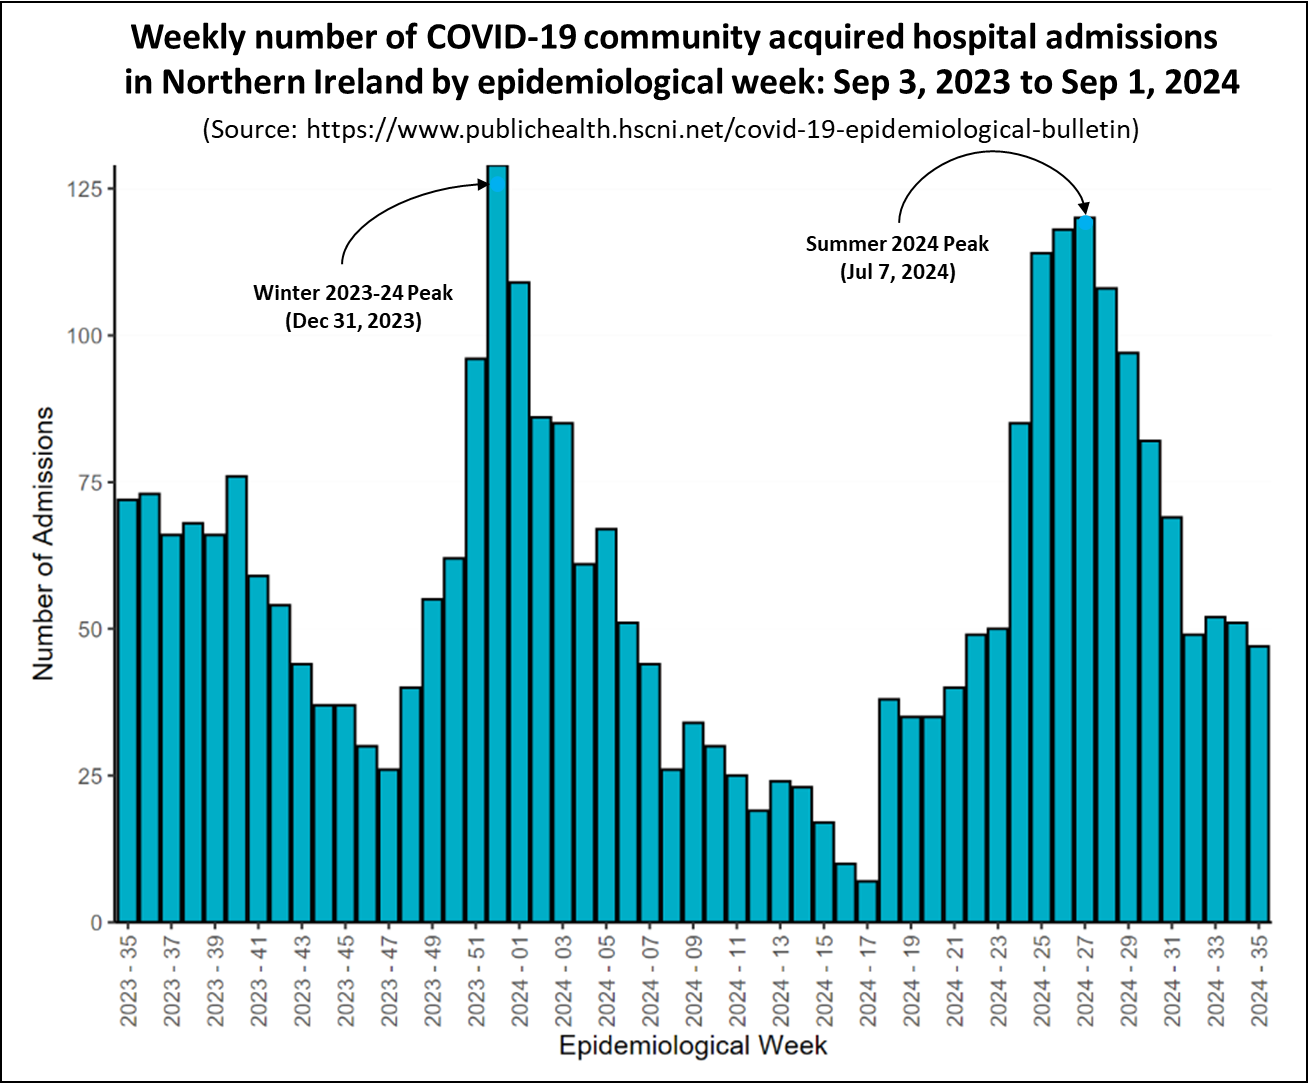
The chart shows a similar pattern to that seen in Scotland Wales, with the 'summer' wave's peak nearly reaching the heights of the 'winter' wave. However, since then the number of admissions has fallen and has now stabilised at a relatively low level indicating that the summer wave over.
Autumn 2024 Booster Vaccination Campaign
Last week, the NHS England published an update on the Autumn/Winter vaccination campaigns for Covid, Flu, and RSV respiratory viruses. The update confirms the dates when vaccinations will start as well as eligibility. The update can be found here.
The Autumn 2024 Covid booster campaign will start on October 3, 2024 and that most flu and COVID-19 vaccinations should be completed by December 20, 2024. The complete list of individuals eligible for the Autumn 2024 booster published by the UKHSA across all four nations of the UK are:
adults aged 65 years and over;
residents in a care home for older adults;
individuals aged 6 months to 64 years in a clinical risk group;
frontline NHS and social care workers: and
those working in care homes for older people.
The only difference from the Autumn 2023 booster campaign is that “persons aged 12 to 64 years who are household contacts of people with immunosuppression” are no longer eligible.
Eligible individuals will either be contacted directly by their General Practice or will be able to book on the national booking system from Monday September 23, 2024.
Covid Deaths in England and Wales
The Office of National Statistics (ONS) publishes weekly reports on the number of deaths recorded on death certificates that are due to Covid or where Covid was involved. The data available is for both England and Wales. The following chart compares the number of deaths due to Covid in England and Wales by the week of registration for 2023-24 with the previous 12 months. The chart does not include deaths where Covid was identified as a contributing cause on the death certificate.
The chart indicates that deaths due to Covid in England and Wales have continued to fall from the recent summer peak and they are now lower than the figures reported for the same period a year ago.
Overall the weekly death toll due to Covid in 2023/24 has seen a substantial decrease from the previous year. In the 12 months leading up to Aug 23 , 2024, there were 6,818 deaths reported, compared to 13,006 deaths in the previous 12-month period — a 48% reduction.
In conclusion
Although the amount of data currently being published has decreased, the limited information available for England suggests that although Covid levels are still higher than those seen in may they are now falling indicating an end to the ‘summer’ wave.
Data from Scotland, Wales, and Northern Ireland suggest that the recent 'summer' wave of Covid saw higher levels than the 'winter' wave. Nevertheless, the most recent figures indicate that this surge has probably ended.
Lastly, the UK Health Security Agency has released the eligibility details for the Autumn 2024 booster campaign, which largely follows the criteria of previous autumn campaigns.
As always, if you have any comments on this Covid Situation Report or suggestions for topics to cover, please post a message below.
Appendix 1. How reliable are Daily Covid Case Rates?
The UKHSA Covid dashboard continues to publish daily case rates for England on a weekly basis. As the majority of testing now occurs in hospitals or under medical supervision, these rates should be closely aligned with hospital admissions and the positivity rate of tests.
The first panel chart in this section tests that assumption by comparing the daily case rate per 100,000 individuals, shown in red, with daily hospital admissions for Covid reported by NHS England, depicted in blue.
The chart shows that while Covid case rates generally mirror the pattern of Covid hospital admissions, there is a significant disparity in the scale of changes. The grey shaded areas on each chart highlights the difference between the peak of the winter wave and the recent peak in June. Case rates experienced a 64% decrease, whereas hospital admissions saw a reduction of only 32% between the winter and June peaks.
In conclusion, although case rates are useful for indicating the overall trend of Covid in the population, they do not accurately reflect the extent of change. The likely reason for this is that testing levels have decreased by about a half since January.
🙏
Thanks again Bob.
Just to note that American medical expert Eric Topol has just posted on his substack a long conversation with Harvard based air-quality researcher Joshua Allen. Covid was a turning point and though the issues go wider than viruses, it is all highly relevant to us here in the UK it seems to me.