


Covid Situation Report: Oct 31, 2024
Update on Covid providing information on prevalence and hospital admissions for England and its regions. This post is best viewed using the browser or Substack app.

Introduction.
This report belongs to a weekly series summarising the Covid situation across the UK's home nations and the English regions.
A reminder that not all of the data previously included in the situation update is now available on a weekly basis. Where relevant, changes to the content and data sources have been noted.
This weeks report includes the most recent weekly test positivity rates and hospital admissions data for England. It also incorporates daily case rates from the UKHSA Covid dashboard, alongside the latest data for Scotland, Wales, and Northern Ireland. Finally, the report provides a brief update on England's Autumn 2024 Covid booster campaign.
Summary.
This week's data has Covid levels falling across England and Northern Ireland whilst remaining stable in Scotland and Wales.
In England, the Covid test positivity rate, hospital admissions and case rates all fell this week, though they remain at moderately high levels.
In Scotland, hospital admissions and bed occupancy remained stable although at levels higher than earlier in the year.
In the past week, hospital admissions for Wales remained stable but moderately high.
In Northern Ireland, Flu and RSV activity continued to increase across some surveillance indicators. However, Covid levels fell slightly and hospital admissions are now lower than for the other respiratory viruses.
Vaccination remains a powerful way to minimise the risk of Covid and the Autumn 2024 booster campaign continues it’s very strong start, with over 44% of the targeted demographic aged 65 years and older already vaccinated. However, there is a notable gap in vaccination coverage among those clinically at risk who are under the age of 65, individuals in the London region, and ethnic minorities.
As a reminder, the NHS have reconfirmed eligibility criteria for the Autumn 2024 booster campaign which started on October 3, 2024 and will close earlier than previous years on Friday, December 20. Eligibility can be established and bookings made at the following link.
As always, it’s important to remember that the risk of hospitalisation from Covid infection increases significantly with age and for those immunocompromised. Also Long Covid remains a risk for all as shown by the recent ONS report. Therefore, it is prudent to take appropriate measures such as self-isolating when experiencing Covid symptoms and enhancing ventilation or wearing masks whenever possible.
Status of main respiratory diseases in England.
This section starts with the latest available data on positivity rates for primary respiratory infections in England. It is important to understand that positivity differs from prevalence, which refers to the overall percentage of COVID-19 in the general population. Appendix 1 provides a more detailed explanation of the difference and why positivity rates are a useful indicator of trends in Covid infection levels.
The chart below displays the test positivity rates for the main respiratory illnesses in England, including Flu, Covid, RSV, and Rhinovirus.
The Covid positivity rate has fallen this week, though it remains at a relatively high level close to that seen at the height of the summer surge. Rhinovirus rates are also falling having reached their peak three weeks ago. Meanwhile, Flu and RSV rates are beginning to show signs of rising, yet continue to be at low levels.
The following panel charts show the Covid positivity rate by age. Hover your cursor over the chart lines to show to compare positivity rates.
Covid test positivity has fallen for most age groups but remains high in those aged 65 years and older.
The final chart in this section shows weekly hospital admissions per 100,000 people in England for the main respiratory diseases.
In the past week, weekly hospital admission rates for Covid have also started to fall although they remain at moderately high levels. Whilst admissions for Flu remain low, and RSV admissions are starting to rise.
It's important to note that while testing policies have been updated from April 1, 2024, the guidelines for testing patients showing Covid symptoms or when a positive result would change the patient's treatment remained unchanged. Consequently, the number of Covid hospital admissions should be a dependable indicator of the virus's prevalence in the community for the period shown in these charts.
Covid case rates in England
The UKHSA Covid dashboard continues to publish daily case rates for England on a weekly basis. As the majority of testing now occurs in hospitals or under medical supervision, these rates should closely align with hospital admissions. However, a comparison of daily case rates and daily admissions shows that this is not the case.
Appendix 2 indicates that although Covid case rates typically reflect the pattern of hospital admissions, there is a notable discrepancy in the magnitude of changes, with admissions experiencing a more pronounced fluctuation than case rates. Therefore, while case rates are helpful in signalling the general trend of Covid within the population, they do not precisely represent the degree of change.
The following chart shows daily case rate per 100,000 individuals.
The chart indicates that Covid case rates once again fell during the week and look to have peaked. It is important to note, as detailed above and in Appendix 1, that comparisons with the peak in Winter 2023 are not recommended.
Scotland weekly hospital admissions and bed occupancy
Scotland continues to publish weekly data on hospital admissions and bed occupancy for Covid as well as waste water monitoring data. The dashboard for Scotland’s data can be accessed here.
The following panel chart shows the most recent data for weekly Covid hospital admissions depicted in blue, together with the number of beds occupied by Covid patients, shown in orange. The number of occupied beds represent patients being treated for Covid as well as those being treated with Covid.
The charts shows that the recent 'summer' Covid wave in Scotland led to more hospital admissions and a greater number of beds occupied by Covid patients compared to the 'winter' wave. This contrasts with England, where 'summer' hospital admissions did not surpass those seen in 'winter'.
The fall in weekly Covid admissions and bed occupancy from the summer peak has now stopped and have once again remained unchanged, though they are at higher levels than earlier in the year.
Scotland remains the only home nation that is monitoring Covid levels using wastewater sampling. Recently reporting has been paused as responsibility for laboratory Covid water samples testing transferred from the Scottish Environment Protection Agency (EPA) to NHS Lothian. This week Scotland resumed reporting Covid levels in wastewater, with data available up to the end of August.
The wastewater sampling data indicates that the elevated Covid levels noted at the beginning of August have fallen and at the end of August were relatively low.
Wales Covid cases and hospital admissions.
Public Health Wales are in the process of revising the data published on respiratory viruses consequently there is limited data available this week.
The following chart provides the trend for weekly hospital admissions in Wales.
Whilst the number of hospital admissions for Covid fell slightly this week they remain at a moderately high level, albeit lower than the figures reported last year.
Status of main respiratory diseases in Northern Ireland.
Recently Public Health Northern Ireland began issuing a combined surveillance report on influenza, respiratory syncytial virus (RSV), and COVID-19 to offer a comprehensive view of the epidemiology of these infections within Northern Ireland. The new report, published every Thursday, can be accessed here.
The first chart in this section shows the test positivity rates in Northern Ireland for the main respiratory illnesses — Flu, RSV, and Covid.

The chart indicates that Covid levels have fallen this week and are much lower than the summer peak, though they remain higher than the rates of other respiratory viruses.
The chart below presents the weekly count of hospital admissions for the main respiratory illnesses where the infection was contracted in the community, thereby excluding patients who contracted Covid while in hospital. It is important to note that the hospital admissions data for other home nations include patients who contracted infections in the hospital, making them not directly comparable to the data from Northern Ireland.
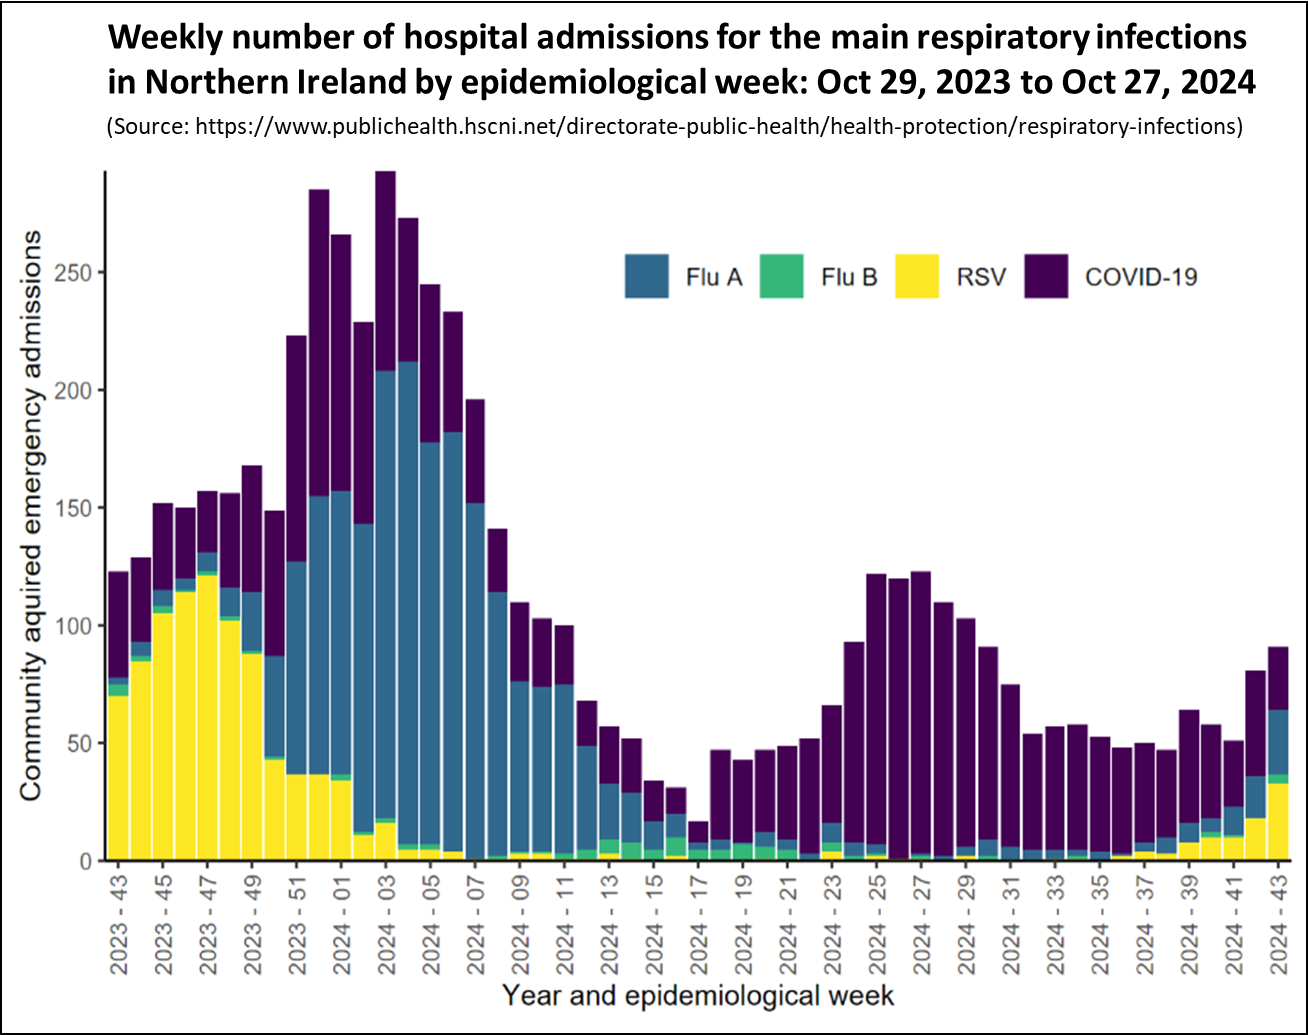
The chart shows that for most of 2024, the bulk of hospital admissions for respiratory infections stemmed from Covid. However, in recent weeks, hospital admissions for Covid have declined and are nearing the lower figures seen earlier in the year. Meanwhile, hospital admissions for Flu and RSV have increased and currently exceed those for Covid.
Covid Vaccination Levels in England
The Autumn 2024 Covid booster campaign started started on October 3 and will close on December 20. Similar to previous booster campaigns, eligibility is restricted to those at the highest risk of hospitalisation and death. Those eligible are older people in care homes, individuals 65 years and older, the immunosuppressed. Eligibility can be checked and boosters booked at this link. In addition, health and care workers will be offered boosters through their employers.
This year's Autumn vaccination campaign is set to end earlier than in previous years, with the majority of vaccinations scheduled to be completed by Friday, 20 December 2024. However, outreach efforts to administer vaccines in underserved communities will continue until 31 January 2025.
The following chart shows the number of Covid vaccinations given by week for each of the booster campaigns in England.
During the first three weeks of the Autumn 2024 Covid booster campaign, just over 6.9 million doses have been administered. So far, this years Autumn campaign is advancing at a pace quicker than any of the previous campaigns.
The following table shows the cumulative Autumn 2024 coverage for each of the target groups by week.
There has been significant progress vaccinating the target groups aged 65 and older, whilst those immunosuppressed under the age of 65 remain less well vaccinated.
Similar to past campaigns, booster vaccination coverage in London continues to be worse than other regions, with only 28% of individuals aged 65 years and over receiving a dose, and just 10% of those under 65 who are immunosuppressed.
There are also large ethnic inequalities in Autumn 2024 booster coverage as illustrated in the following chart.
Booster coverage for eligible individuals 65 years and older identifying as white are nearly seven times more likely to be vaccinated than those in the least vaccinated ethnic group.
Successive booster campaigns have shown a worrying decline in coverage. For example, the Autumn 2023 booster campaign ended with only 65% of individuals aged 65 to 74 years vaccinated, and 76% of those aged 75 and older.
In conclusion
Although the amount of data currently being published has decreased, the information available for England show that Covid levels are starting to fall.
Recent data from Scotland, Wales, and Northern Ireland indicate that the 'summer' wave of Covid-19 saw higher infection levels compared to the 'winter' wave. Since reaching a peak in the summer, infection levels have declined and now remain relatively stable in Scotland and Wales, while in Northern Ireland, they are gradually decreasing.
As always, if you have any comments on this Covid Situation Report or suggestions for topics to cover, please post a message below.
Appendix 1. Test positivity rates and prevalence
Positivity rates are derived from the results of hospital laboratory tests conducted on patients exhibiting symptoms of respiratory diseases. Test positivity is the percentage of patients who test positive for Covid of the total number of patients tested. Since the individuals tested for this measure are not a representative sample of the general population it differs from prevalence, which is derived from a representative sample of the population.
Test positivity rates, while not directly estimating the number of Covid infections in the general population, can be a valuable indicator of the infection trend. The panel chart below compares the weekly test positivity rate among hospital patients with respiratory symptoms to the prevalence of Covid in the general population, as reported in the Winter Infection Survey.
The chart shows that the weekly test positivity rates for patients with symptoms of respiratory infections follows the same pattern as the prevalence for Covid reported by the Winter Infection Survey. Since the Winter Infection Survey is based on a representative sample of the general population this supports using test positivity as a useful proxy for infection trends.
Appendix 2. How reliable are Daily Covid Case Rates?
The UKHSA Covid dashboard continues to publish daily case rates for England on a weekly basis. As the majority of testing now occurs in hospitals or under medical supervision, these rates should be closely aligned with hospital admissions and the positivity rate of tests.
The first panel chart in this section tests that assumption by comparing the daily case rate per 100,000 individuals, shown in red, with daily hospital admissions for Covid reported by NHS England, depicted in blue.
The chart shows that while Covid case rates generally mirror the pattern of Covid hospital admissions, there is a significant disparity in the scale of changes. The grey shaded areas on each chart highlights the difference between the peak of the winter wave and the recent peak in June. Case rates experienced a 64% decrease, whereas hospital admissions saw a reduction of only 32% between the winter and June peaks.
In conclusion, although case rates are useful for indicating the overall trend of Covid in the population, they do not accurately reflect the extent of change. The likely reason for this is that testing levels have decreased by about a half since January.
Thank you. Continue to be very grateful to you and Independent Sage for stepping into the vacuum to keep us informed
Wondering if the the regional discrepancies still hold in England? Local outburst in North/NorthEast 2 weeks ago suggests still lively community spread. Left even younger folks weak/wobbly/brain fogged, recovering but a couple or 3 weeks largely out of action.
Note that Prof Pagel suggests evidence accumulating that vaccines can lower risks of catching covid, which I would agree would need leadership in UK to gain any credibility. Got our jabs Flu/Covid by NHS Scot appt. on Tuesday but mood music was to rather play down 'covid'. HEPA filtration & judicious FFP3 masks perhaps helped us x2 80y+ remain uninfected from recent episode 'covid-in-the-house' +ve 10 days.