


Covid Situation Report: May 8, 2025
Update on Covid providing information on prevalence and hospital admissions for England and its regions. This post is best viewed using the browser or Substack app.

Introduction.
This report belongs to a weekly series summarising the Covid situation across the UK's home nations.
This week's report covers the latest weekly test positivity rates and hospital admissions data for England, along with the most recent data for Scotland, Wales and Northern Ireland. An update on the Spring 2025 Covid booster campaign is also provided. Finally, the report presents the latest Covid surveillance data from some other countries.
Summary.
Once again the good news continues with Covid data indicating low levels across England, Scotland, Wales and Northern Ireland.
Flu levels continue to fall and are now lower than Covid in all Home Nations.
This means that individuals with Covid-like symptoms are more likely to be suffering from Human metapneumovirus (hMPV) or Rhinovirus rather than Covid.
In England, the Covid test positivity rate continued to increase slightly but remains at low levels. Meanwhile, hospital admissions for Covid decreased and are at low levels. Flu test positivity and hospital admissions continued to fall and are at low levels, well below those for Covid. Finally, the test positivity rate for Human metapneumovirus (hMPV) rose and remains at a moderately high level.
In Scotland, Covid hospital admissions remain at very low levels. However, there has been a slight increase both in beds occupied by patients with Covid and wastewater monitoring levels although they also remain relatively low. Flu admissions are now at relatively low levels and are now slightly lower than for Covid.
This week Covid hospital admissions in Wales continued to remain low.
In Northern Ireland, Covid activity increased very slightly but remain at low activity levels. Flu activity fell to low levels and RSV is at baseline activity levels.
The latest data from several other countries (USA, Germany, Denmark, Netherlands and New Zealand) indicate that Covid levels continue to be low and are following a similar trend to the UK.
The NHS Spring 2025 Covid Booster campaign opened on April 1 and will run until June 17, 2025. In England, just under 3.1 million doses given to date with 43% of those aged 75 years and older vaccinated. At present, coverage in Scotland and Wales is progressing but remains lower.
Those eligible for free vaccinations on the NHS are:
adults aged 75 years and over;
residents in a care home for older adults; and
individuals aged 6 months and over who are immunosuppressed.
Bookings for Spring 2025 booster vaccinations can be made at the following link:
A reminder that for individuals not covered by the NHS, Covid and Flu vaccinations may be obtainable for a fee at local pharmacies.
As always, it’s important to remember that the risk of hospitalisation from Covid increases significantly with age and for the immunocompromised. Therefore, it is important to take appropriate measures such as self-isolating when experiencing Covid symptoms and enhancing ventilation or wearing masks whenever possible.
Status of main respiratory diseases in England.
This section starts with the latest available data on positivity rates for primary respiratory infections in England. It is important to understand that positivity differs from prevalence, which refers to the overall percentage of COVID-19 in the general population. Appendix 1 provides a more detailed explanation of the difference and why positivity rates are a useful indicator of trends in Covid infection levels.
The first chart in this section shows the test positivity rate for all Covid tests taken, including those outside of hospitals, and is mapped against the UKHSA activity thresholds. The thresholds are based on the historical trend for Covid test positivity and, consequently, represent a relative risk. More details on this approach can be found in the Guide to Covid Surveillance Metrics.
The chart shows a slight increase to the test positivity rate which is now just above the baseline threshold of activity but still indicating a relatively low levels of risk.
The following chart displays the test positivity rates for the main respiratory illnesses in England, covering Flu, Covid, RSV, and Rhinovirus. This positivity rate is only for tests carried out in hospital so differs slightly from the previous chart. However, taking this approach allows a fair comparison between the different viruses.
The Covid positivity rate increased very slightly this week but continues to remain low. Flu rates continued to fall and are well below those of Covid. RSV rates continue at very low levels, whereas Rhinovirus rates remain stable at a moderately high level.
The chances are that if you have Covid-like symptoms you are more likely to be suffering from Rhinovirus rather than RSV or Covid.
The next chart in this section shows weekly hospital admissions per 100,000 people in England for the main respiratory diseases.
Over the past week, weekly hospital admission rates for Covid decreased very slightly and remained low and below baseline activity levels. Meanwhile, admission rates for Flu continued to fall from their recent peak and are now well below Covid admission levels. Admissions for RSV are are no longer provided.
Finally, although press coverage about the risk of Human metapneumovirus (hMPV) has declined, UKHSA continue to report on its progress. The following chart shows the trend in the test positivity rate hMPV in hospital patients admitted with respiratory illness in England for the past two years.
Human metapneumovirus (hMPV), a virus with symptoms similar to Flu, is a seasonal virus that usually peaks in early January and then falls in February. This week test positivity increased to4.0 %, showing that this years wave is not yet over.
Scotland weekly hospital admissions and bed occupancy
Scotland continues to publish weekly data on hospital admissions and bed occupancy for Covid as well as wastewater monitoring data. The dashboard for Scotland’s data can be accessed here.
The following panel chart shows the most recent data for weekly Covid hospital admissions depicted in blue, together with the number of beds occupied by Covid patients, shown in orange. The number of occupied beds represent patients being treated for Covid as well as those being treated with Covid.
This week Covid admissions remained stable and at low levels. However, the number of beds occupied by patients testing positive for Covid has increased. Since these include both patients being treated for Covid and those being treated for other reasons this may be an early sign of increasing levels of Covid in hospitals and in the community, albeit from low levels.
Scotland remains the only home nation that is monitoring Covid levels using wastewater sampling and the following chart shows the seven day average of Covid levels found up to May 1, 2025.
The wastewater sampling data shows that the high Covid levels observed at the start of August 2024 dropped significantly to very low levels in the first 3 months of 2025. However, there have been slight increases in the past few weeks although levels remain relatively low.
Finally, the following chart compares the weekly hospital admissions for the main respiratory viruses in Scotland.
The chart shows that flu-related emergency hospital admissions rose sharply in December and Public Health Scotland reported that this reached a record high of 1606 admissions for the week ending Dec 29. This surge placed a considerable burden on hospitals. However, Flu admissions have fallen significantly in the past weeks and are now at low levels, below those for Covid.
Wales Covid hospital admissions.
From May to October, Public Health Wales will publish reports on the status of respiratory viruses fortnightly. Data was published this week and the charts have been updated.
The following chart provides the trend for weekly hospital admissions in Wales up to week ending May 4, 2025.
This week, hospital admissions for Covid in Wales remained at relatively low levels.
In contrast, the following chart illustrates that hospital admissions for flu in Wales were high during the holiday period but have fallen significantly and are also now at very low levels.
Status of main respiratory diseases in Northern Ireland.
Recently Public Health Northern Ireland began issuing a combined surveillance report on influenza, respiratory syncytial virus (RSV), and COVID-19 to offer a comprehensive view of the epidemiology of these infections within Northern Ireland. The report, published every Thursday, can be accessed here.
The first chart in this section shows the test positivity rates in Northern Ireland for the main respiratory illnesses — Flu, RSV, and Covid.
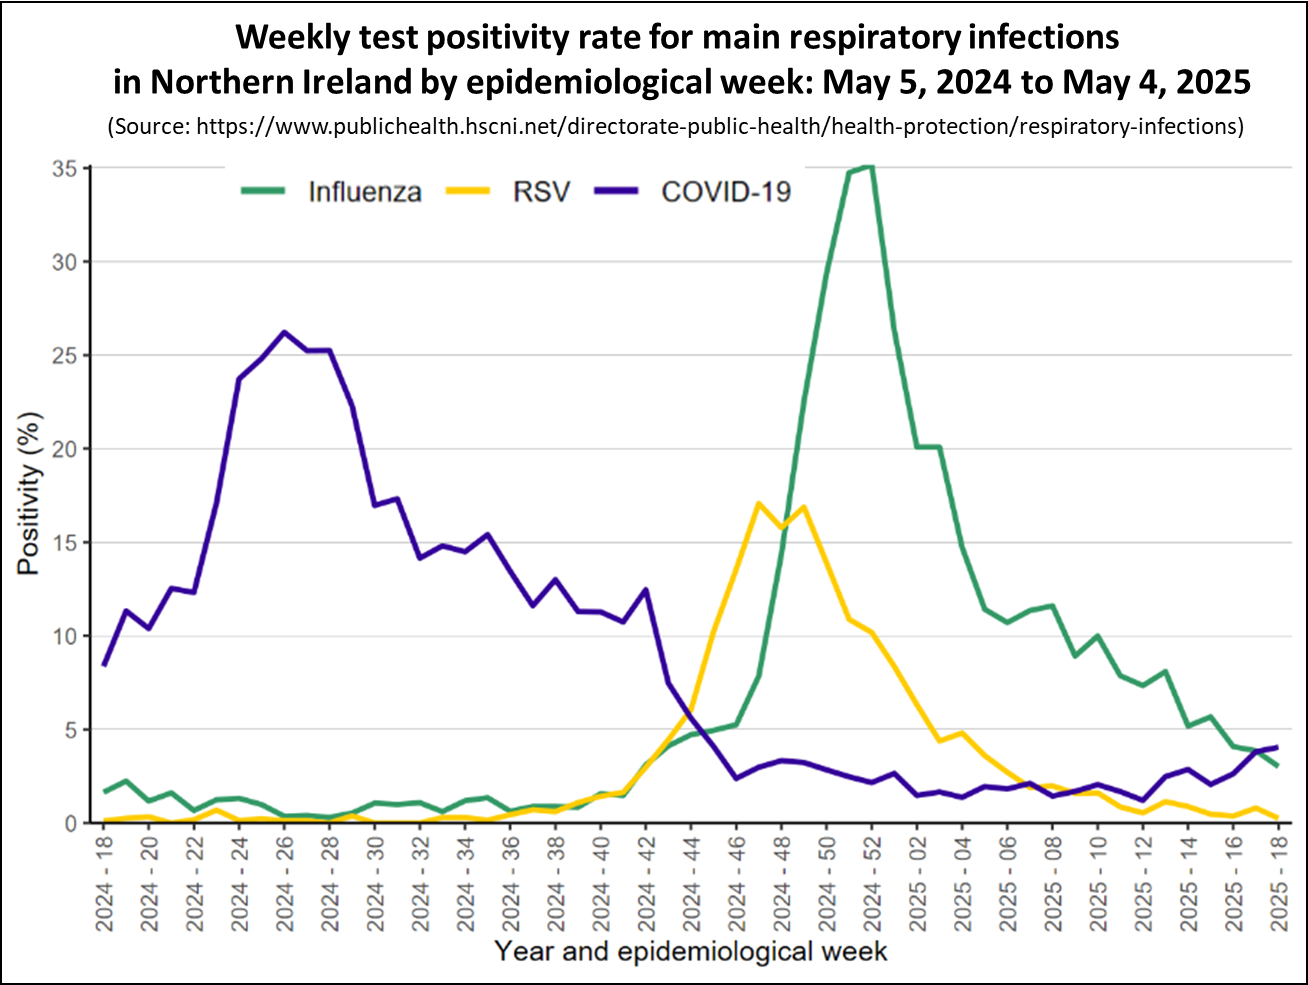
The chart shows that Covid levels, depicted in purple, remained low this week despite a slight increase. Positivity rates for Flu, shown in green, have fallen from the winter peak and are now at relatively low levels.
The chart below presents the weekly count of hospital admissions for the main respiratory illnesses where the infection was contracted in the community, thereby excluding patients who contracted Covid while in hospital. It is important to note that the hospital admissions data for other home nations include patients who contracted infections in the hospital, making them not directly comparable to the data from Northern Ireland.
The chart shows that for most of 2024, the bulk of hospital admissions for respiratory infections stemmed from Covid. However, since November hospital admissions for Covid, indicated in purple, have been low.

Meanwhile, hospital admissions for the Flu, depicted in blue, increased significantly in December. However, Flu admissions have fallen from the December peak and are now relatively low.
Spring 2025 Covid Booster Campaign
The NHS Spring 2025 Covid Booster campaign opened on April 1 and will run until June 17, 2025. Those eligible are older people in care homes, individuals 75 years and older, the immunosuppressed aged 6 months and over.
The data in this section is only for NHS vaccinations and does not include privately administered doses.
The next chart shows the number of Covid vaccinations given by week for each of the booster campaigns in England.
The Spring 2025 booster campaign has started well with 2,711,054 doses administered in England during the first four weeks of the campaign. Comparisons with previous spring campaigns are difficult because earlier campaigns started vaccinations in care homes ahead of the wider population and the number of working days varies due to bank holidays. Adjusting for these factors 159,474 people per day were vaccinated in the first four weeks of this years spring campaign, whereas the 2024 campaign vaccinated 166,994 people per day over the same period.
The final chart in this section compares vaccine coverage for those aged 75 years and older in the three Home Nations where data is published.
Covid levels in other countries
Other countries continue to monitor the levels of Covid. Most are using hospital admissions for Covid, but some continue to publish waste water surveillance data which provides a better understanding of levels of Covid in the overall community.
The following chart shows the viral load for Covid in wastewater samples for Germany up to April 30, 2025.

The chart shows that Covid levels remain low following an increase in Autumn 2024.
The next chart shows the wastewater surveillance data for the Netherlands which shows a very similar pattern to Germany with Covid levels falling slightly and are now close to their lowest levels in over two years.
Denmark has also continued to monitor Covid levels in wastewater. Although the trend is different from Germany and the Netherlands, the following chart shows that Covid levels continue to be at very low levels, despite a very small increase in the past weeks.
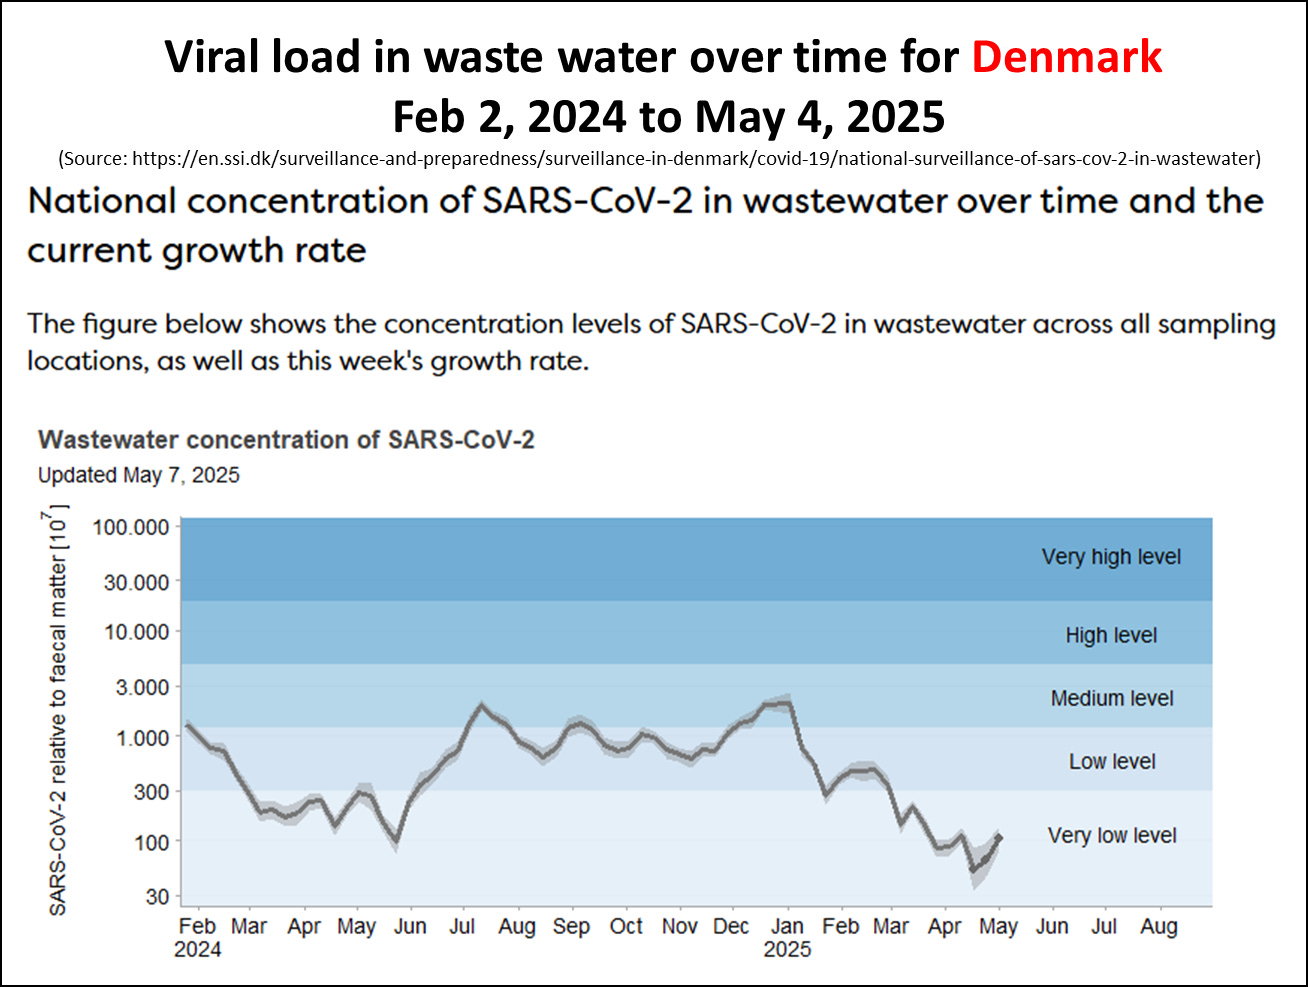
Covid activity levels measured by wastewater monitoring also remain very low.
The CDC also publishes data for the United States of America on Covid levels measured by wastewater and Covid hospital admission. The next chart shows the national level of Covid detected in wastewater samples which have remained stable over the past weeks and are at low activity levels. Levels are also low across all regions of the USA.
The final chart in this section depicts the latest hospital admission rate by season for the USA from the start of the pandemic until April 23, 2025.

Once again, we can see that Covid levels in the USA as measured by wastewater sampling and hospital admissions are relatively low and are following a similar path to other countries.
In conclusion
Although the amount of data currently being published has fallen, the information available for England show that Covid levels are at relatively low levels and lower than Flu. Recent data also indicates that Scotland, Wales and Northern Ireland also at low levels of Covid.
The Spring 2025 booster campaign has started and by the end of the third week just over 43% of those aged 75 years and older had been vaccinated in England. However, coverage in Scotland and Wales is much lower.
Across all Home Nations, Flu levels are now at low levels. The Winter peak is over.
The latest Covid levels in several other countries continue to be low and are following a similar trend to the UK.
As always, if you have any comments on this Covid Situation Report or suggestions for topics to cover, please post a message below.
Appendix 1. Test positivity rates and prevalence
Positivity rates are derived from the results of hospital laboratory tests conducted on patients exhibiting symptoms of respiratory diseases. Test positivity is the percentage of patients who test positive for Covid of the total number of patients tested. Since the individuals tested for this measure are not a representative sample of the general population it differs from prevalence, which is derived from a representative sample of the population.
Test positivity rates, while not directly estimating the number of Covid infections in the general population, can be a valuable indicator of the infection trend. The panel chart below compares the weekly test positivity rate among hospital patients with respiratory symptoms to the prevalence of Covid in the general population, as reported in the Winter Infection Survey.
The chart shows that the weekly test positivity rates for patients with symptoms of respiratory infections follows the same pattern as the prevalence for Covid reported by the Winter Infection Survey. Since the Winter Infection Survey is based on a representative sample of the general population this supports using test positivity as a useful proxy for infection trends.
Thanks again!
🙏