


Covid Situation Report: May 22, 2025
Update on Covid providing information on prevalence and hospital admissions for England and its regions. This post is best viewed using the browser or Substack app.

Introduction.
This report belongs to a weekly series summarising the Covid situation across the UK's home nations.
This week's report covers the latest weekly test positivity rates and hospital admissions data for England, along with the most recent data for Scotland, Wales and Northern Ireland. An update on the Spring 2025 Covid booster campaign is also provided. Finally, Covid levels in Singapore and Hong Kong have recently risen significantly and the latest data is covered in detail.
Just to let you know that next week’s report will be published on Friday.
Summary.
The good news continues with all Covid data indicating low levels across England, Scotland, Wales and Northern Ireland.
Flu activity fell to very low levels in all Home Nations indicating that the Flu season is over.
In England this week, the Covid test positivity rate remained stable and at relatively low levels. Hospital admissions for Covid also stayed at low levels. Flu test positivity and hospital admissions continued to fall and are at very low levels, well below those for Covid. Finally, the test positivity rate for Human metapneumovirus (hMPV) again fell and is now at a low level of activity.
In Scotland, Covid hospital admissions remain at very low levels. However, there has been a slight increase in wastewater monitoring levels although it remains relatively low. Flu admissions are now at very low levels and much lower than for Covid.
This week Covid hospital admissions in Wales increased but continued to remain relatively low. Admissions for Flu and RSV have virtually stopped.
In Northern Ireland, Some Covid indicators increased very slightly but activity remained at a low levels Flu activity fell to low levels and RSV is at baseline activity levels.
Singapore and Hong Kong have recently seen significant rises in Covid levels although there are some early signs that these increases are slowing. The increases are thought to be due to waning population immunity as no new variants have been identified.
The NHS Spring 2025 Covid Booster campaign opened on April 1 and will run until June 17, 2025. In England, just under 3.5 million doses have been given to date, with 49% of those aged 75 years and older vaccinated. At present, coverage in Scotland and Wales is progressing but remains lower than for England.
Those eligible for free vaccinations on the NHS are:
adults aged 75 years and over;
residents in a care home for older adults; and
individuals aged 6 months and over who are immunosuppressed.
Bookings for Spring 2025 booster vaccinations can be made at the following link:
A reminder that for individuals not covered by the NHS, Covid and Flu vaccinations may be obtainable for a fee at local pharmacies.
As always, it’s important to remember that the risk of hospitalisation from Covid increases significantly with age and for the immunocompromised. Therefore, it is important to take appropriate measures such as self-isolating when experiencing Covid symptoms and enhancing ventilation or wearing masks whenever possible.
Status of main respiratory diseases in England.
Note that from this week the UKHSA National flu and COVID-19 surveillance report will be moving to a condensed summer report and released every two weeks. Consequently, this section will not be updated next week.
This section starts with the latest available data on positivity rates for primary respiratory infections in England. It is important to understand that positivity differs from prevalence, which refers to the overall percentage of COVID-19 in the general population. Appendix 1 provides a more detailed explanation of the difference and why positivity rates are a useful indicator of trends in Covid infection levels.
The first chart in this section shows the test positivity rate for all Covid tests taken, including those outside of hospitals, and is mapped against the UKHSA activity thresholds. The thresholds are based on the historical trend for Covid test positivity and, consequently, represent a relative risk. More details on this approach can be found in the Guide to Covid Surveillance Metrics.
The chart shows that the test positivity rate was unchanged and remained just below the baseline threshold of activity indicating a relatively low level of risk.
The following chart displays the test positivity rates for the main respiratory illnesses in England, covering Flu, Covid, RSV, and Rhinovirus. This positivity rate is only for tests carried out in hospital so differs slightly from the previous chart. However, taking this approach allows a fair comparison between the different viruses.
The Covid positivity rate was broadly unchanged this week and continues to remain low. The Flu rate also remained stable and is well below those of Covid. RSV rates continue at very low levels, whereas Rhinovirus rates remains at a moderately high level.
The chances are that if you have Covid-like symptoms you are more likely to be suffering from Rhinovirus rather than RSV, Flu or Covid.
The next chart in this section shows weekly hospital admissions per 100,000 people in England for the main respiratory diseases.
Over the past week, weekly hospital admission rates for Covid remained stable and below baseline activity levels. Meanwhile, admission rates for Flu continued to fall from their recent peak and are now well below Covid admission levels. Admissions for RSV are are no longer provided.
Finally, although press coverage about the risk of Human metapneumovirus (hMPV) has declined, UKHSA continue to report on its progress. The following chart shows the trend in the test positivity rate hMPV in hospital patients admitted with respiratory illness in England for the past two years.
Human metapneumovirus (hMPV), a virus with symptoms similar to Flu, is a seasonal virus that usually peaks in early January and then falls in February. This week test positivity again reduced to 1.7 %, confirming that this years wave is likely to be over.
Scotland weekly hospital admissions and bed occupancy
Scotland continues to publish weekly data on hospital admissions and bed occupancy for Covid as well as wastewater monitoring data. The dashboard for Scotland’s data can be accessed here.
The following panel chart shows the most recent data for weekly Covid hospital admissions depicted in blue, together with the number of beds occupied by Covid patients, shown in orange. The number of occupied beds represent patients being treated for Covid as well as those being treated with Covid.
This week Covid admissions remained stable and at low levels. However, the number of beds occupied by patients testing positive for Covid fell slightly following the increase in the previous two weeks.
Scotland remains the only home nation that is monitoring Covid levels using wastewater sampling and the following chart shows the seven day average of Covid levels found up to May 16, 2025.
The wastewater sampling data shows that the high Covid levels observed at the start of August 2024 dropped significantly to very low levels in the first 3 months of 2025. However, there have been slight increases in the past few weeks although levels remain relatively low.
Finally, the following chart compares the weekly hospital admissions for the main respiratory viruses in Scotland.
The chart shows that flu-related emergency hospital admissions rose sharply in December and Public Health Scotland reported that this reached a record high of 1606 admissions for the week ending Dec 29. This surge placed a considerable burden on hospitals. However, Flu admissions have fallen significantly in the past weeks and are now at very low levels, well below those for Covid.
Wales Covid hospital admissions.
The following chart provides the trend for weekly hospital admissions in Wales up to week ending May 18, 2025.
Lat week, hospital admissions for Covid in Wales to their lowest level in over two years. However, this week they increased but remain at relatively low levels.
The following chart illustrates that hospital admissions for flu in Wales which were high during December and January have now fallen significantly and are have now almost stopped.
Status of main respiratory diseases in Northern Ireland.
Recently Public Health Northern Ireland began issuing a combined surveillance report on influenza, respiratory syncytial virus (RSV), and COVID-19 to offer a comprehensive view of the epidemiology of these infections within Northern Ireland. The report, published every Thursday, can be accessed here.
The first chart in this section shows the test positivity rates in Northern Ireland for the main respiratory illnesses — Flu, RSV, and Covid.
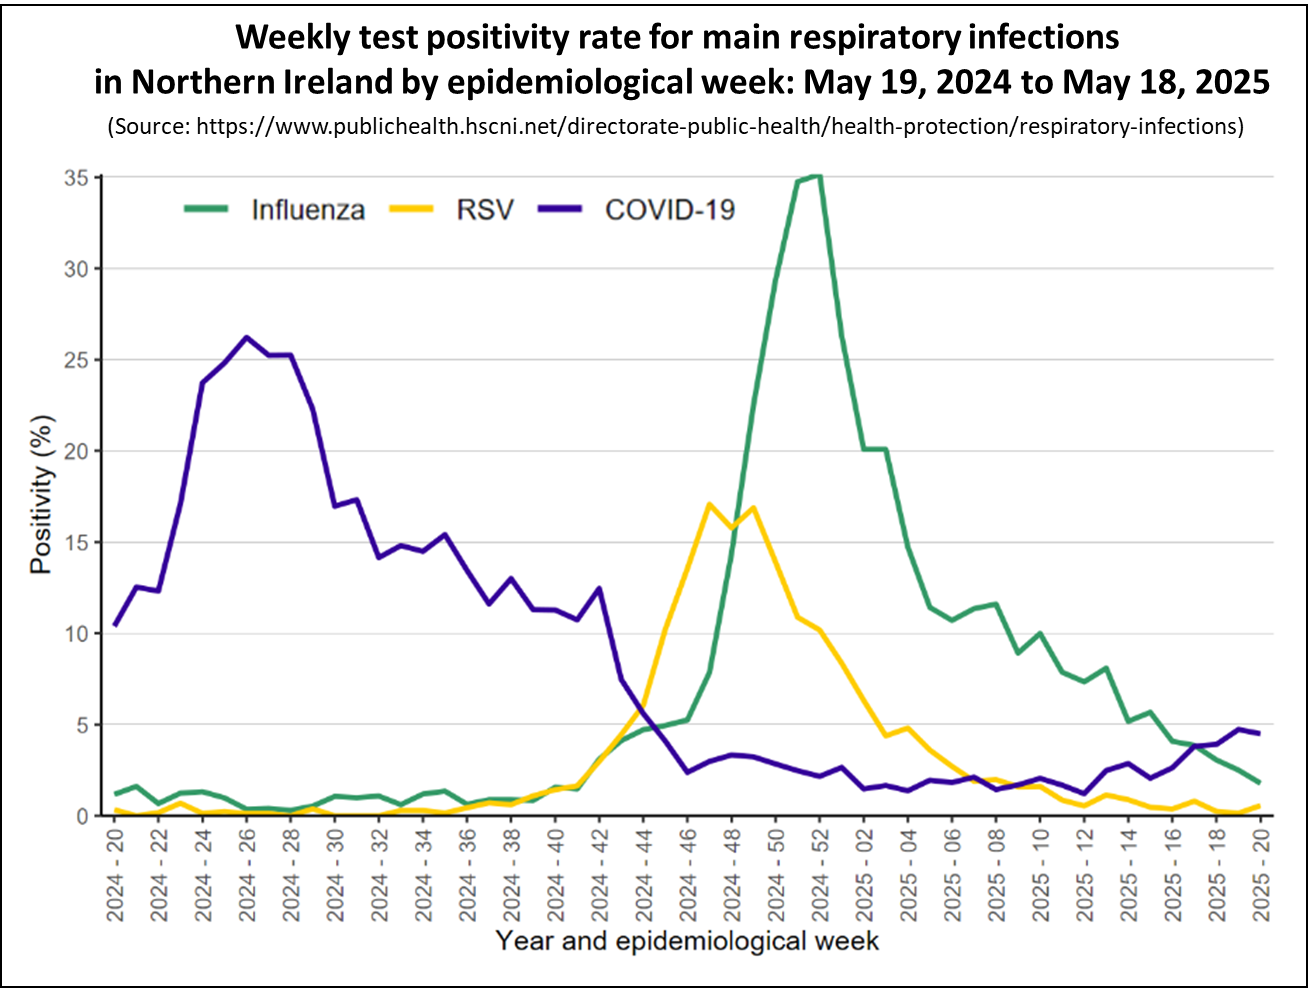
The chart shows that Covid levels, depicted in purple, remained low this week despite a slight increase. Positivity rates for Flu, shown in green, have fallen from the winter peak and are now at relatively low levels.
The chart below presents the weekly count of hospital admissions for the main respiratory illnesses where the infection was contracted in the community, thereby excluding patients who contracted Covid while in hospital. It is important to note that the hospital admissions data for other home nations include patients who contracted infections in the hospital, making them not directly comparable to the data from Northern Ireland.
The chart shows that for most of 2024, the bulk of hospital admissions for respiratory infections stemmed from Covid. However, since November 2024 hospital admissions for Covid, indicated in purple, have been low.
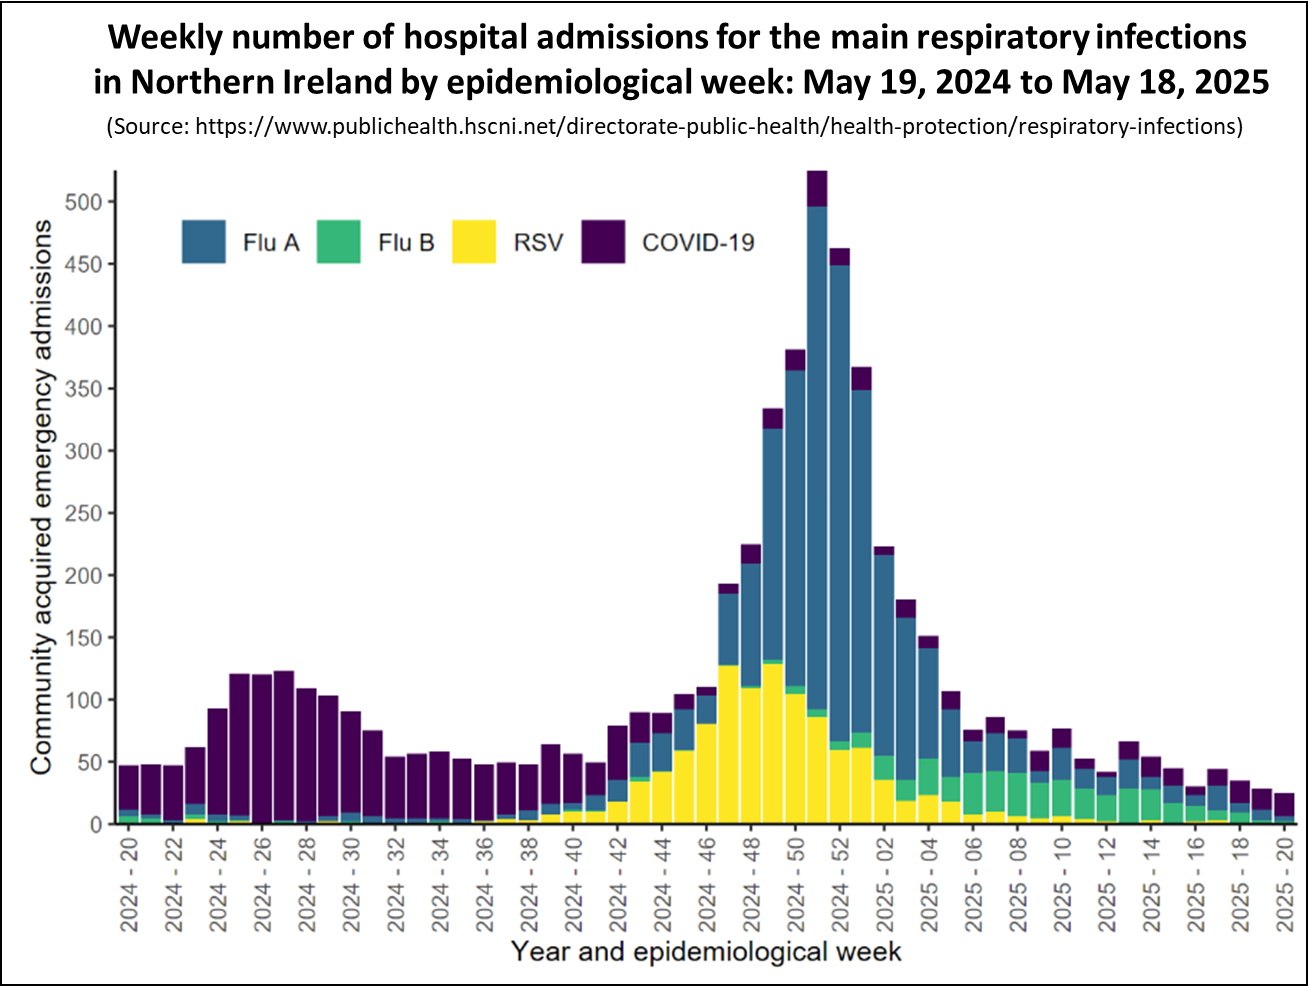
Meanwhile, hospital admissions for the Flu, depicted in blue, increased significantly in December. However, Flu admissions have fallen from the December peak and are now very low, below those for Covid.
Spring 2025 Covid Booster Campaign
The NHS Spring 2025 Covid Booster campaign opened on April 1 and will run until June 17, 2025. Those eligible are older people in care homes, individuals 75 years and older, the immunosuppressed aged 6 months and over.
The data in this section is only for NHS vaccinations and does not include privately administered doses.
The first chart in this section compares vaccine coverage for those aged 75 years and older in the three Home Nations where data is published. The date of the latest available data is in parenthesis after each Home Nations name.
The following chart shows the number of Covid vaccinations given by week for each of the booster campaigns in England.
The Spring 2025 booster campaign is progressing well with 3,468,922 doses administered in England to date. This is comparable with previous campaigns.
Further detail is available for England and the following table shows the progress for those aged 75 years and older, people in care homes, and individuals aged between 6 months and 74 years old that are immunosuppressed.
The table clearly shows that although coverage for those in care homes is progressing well, individuals under the age of 75 years who are immunosuppressed continue to have low coverage.
Covid levels in Singapore and Hong Kong
Last week, the health departments of Singapore and Hong Kong reported a significant increase in Covid levels. This section summarises those reports and provides an update on the latest data available for those countries.
The Singapore Ministry of Health (MOH) and Communicable Diseases Agency (CDA) issued a news release on May 13 highlighting that they are monitoring a recent increase in Covid infections.
The news release reported that the estimated number of Covid cases in the week of April 27 to May 3, 2025 rose to 14,200 cases, compared to 11,100 cases in the previous week. Over the same period, the average daily Covid hospitalisations increased from 102 to 133, equivalent to a rise from 1.7 to 2.2 admissions per 100,000 people.
They also noted that:
There is no indication that the variants circulating locally are more transmissible or cause more severe disease compared to previously circulating variants. As with other endemic respiratory diseases, periodic COVID-19 waves are expected throughout the year. The increase in cases could be due to several factors, including waning population immunity.
Singapore publishes a Weekly Infectious Diseases Bulletin 2025 that includes data on the test positivity rate for people admitted to hospital for respiratory infections. The following chart shows the weekly trend in that test positivity rate.
The chart shows that test positivity increased in May 2025 as it did in the previous year. The latest weeks data shows a small fall in test positivity to 15%. Although it’s too early to say, this latest data may indicate that the wave has peaked.
Hong Kong also issued a news release on May 15, 2025 from the Center for Health Protection (CHP) that urges high-risk individuals to receive Covid vaccines as soon as possible as COVID-19 activity hits one-year high in Hong Kong.
The news release highlighted that the surveillance data for the week ending May 10, the viral load of the SARS-CoV-2 virus from sewage surveillance, the test positivity rate and the cases tested positive by nucleic acid tests in the laboratory had continued to rise significantly over the past four weeks. In particular, the test positivity rate for Covid had increased to 13.7% per cent from 6.2% four weeks ago (the week ending April 12), which is a record high in the past year.
The released concludes with the Controller of the CHP, Dr Edwin Tsui, saying:
"Currently, the proportion of high-risk groups, especially the elderly, receiving booster doses of the vaccine is relatively low. Based on the latest vaccination figures, the CHP projected that about 75 per cent of the elderly aged 65 or above living in Residential Care Homes for the Elderly and 90 per cent of those living in the community had not received booster dose of the COVID-19 vaccine timely according to the CHP’s recommendation. I would like to reiterate my appeal to the high-risk groups, especially the elderly and persons with underlying illnesses, to receive an additional booster dose of the COVID-19 vaccine as soon as possible”
This weeks COVID-19 & FLU EXPRESS report from Hong Kong confirmed that the latest surveillance data showed that the overall activity of Covid has continued to increase, but there are early signs that the upward trend is beginning to slow down.
The following chart shows the test positivity rate for Covid which shows some early signs of slowing down
However, the final chart in this section shows that Covid levels detected in wastewater in Hong Kong have continued to increase and are at very high levels.
In conclusion
Although the amount of data currently being published has fallen, the information available for England show that Covid levels are at relatively low levels and lower than Flu. Recent data also indicates that Scotland, Wales and Northern Ireland also at low levels of Covid.
Singapore and Hong Kong have recently see significant increases in Covid activity across all measures. However, there are some early signs that the rate of increase is slowing.
The Spring 2025 booster campaign has started and by the end of the third week just under 49% of those aged 75 years and older had been vaccinated in England.
Across all Home Nations, Flu levels are now very low. The Winter peak is over.
As always, if you have any comments on this Covid Situation Report or suggestions for topics to cover, please post a message below.
Appendix 1. Test positivity rates and prevalence
Positivity rates are derived from the results of hospital laboratory tests conducted on patients exhibiting symptoms of respiratory diseases. Test positivity is the percentage of patients who test positive for Covid of the total number of patients tested. Since the individuals tested for this measure are not a representative sample of the general population it differs from prevalence, which is derived from a representative sample of the population.
Test positivity rates, while not directly estimating the number of Covid infections in the general population, can be a valuable indicator of the infection trend. The panel chart below compares the weekly test positivity rate among hospital patients with respiratory symptoms to the prevalence of Covid in the general population, as reported in the Winter Infection Survey.
The chart shows that the weekly test positivity rates for patients with symptoms of respiratory infections follows the same pattern as the prevalence for Covid reported by the Winter Infection Survey. Since the Winter Infection Survey is based on a representative sample of the general population this supports using test positivity as a useful proxy for infection trends. However it is not possible to use test positivity to estimate prevalence.
Thank you as ever for the detailed update and very interesting overview of what's happening in SG and HK.
Thanks as ever for the report. A welcome dose of fact on social media too full of fiction. Do you get updates from the USA by any chance? It may make an interesting long term study.....