


Covid Situation Report: Mar 20, 2025
Update on Covid providing information on prevalence and hospital admissions for England and its regions. This post is best viewed using the browser or Substack app.

Introduction.
This report belongs to a weekly series summarising the Covid situation across the UK's home nations.
This week's report includes the latest weekly test positivity rates and hospital admissions data for England, along with the most recent data for Scotland, Wales, and Northern Ireland. In addition, there is a summary of a recent study on Long Covid prevalence in England.
Summary.
This week continues with Covid good news, as the data indicates low levels across England, Scotland, Wales, and Northern Ireland.
Whilst Flu levels are currently higher than Covid and RSV they are falling across all Home Nations, indicating that the Winter Flu season is coming to a close. RSV infection indicators remain low.
This means that individuals with Covid-like symptoms are more likely to be suffering from flu or a cold rather than Covid or RSV.
In England, the Covid test positivity rate, and hospital admissions remained stable and at low levels. Flu test positivity and hospital admissions continue to fall.
The test positivity rate for hMPV has fallen for the past few weeks but remains moderately high.
In Scotland, Covid hospital admissions and bed occupancy are at very low levels with wastewater monitoring levels continuing at their lowest ever. Flu admissions are also now at relatively low levels.
This week, Covid hospital admissions in Wales continued to remain low.
In Northern Ireland, Covid indicators continue at low levels and are currently below those of other respiratory viruses. RSV and Covid activity decreased across the majority of surveillance indicators; however, Flu remains moderately high.
This week, a study on self-reported Long Covid in England was published. The study revealed that in 2023, 4.8% of survey respondents reported having Long Covid, while 9.1% were unsure. They also found that there is an unequal distribution of Long Covid in England, with the condition being more prevalent in minority and disadvantaged groups.
Bookings for the NHS Autumn Covid booster are now closed. However, there will be a Spring 2025 campaign which will run from April 1 to June 17, 2025. Those eligible will be:
adults aged 75 years and over;
residents in a care home for older adults; and
individuals aged 6 months and over who are immunosuppressed.
Further details can be found here.
A reminder that for individuals not covered by the NHS, Covid and Flu vaccinations may be obtainable for a fee at local pharmacies.
As always, it’s important to remember that the risk of hospitalisation from Covid increases significantly with age and for the immunocompromised. Therefore, it is important to take appropriate measures such as self-isolating when experiencing Covid symptoms and enhancing ventilation or wearing masks whenever possible.
Status of main respiratory diseases in England.
This section starts with the latest available data on positivity rates for primary respiratory infections in England. It is important to understand that positivity differs from prevalence, which refers to the overall percentage of COVID-19 in the general population. Appendix 1 provides a more detailed explanation of the difference and why positivity rates are a useful indicator of trends in Covid infection levels.
The first chart in this section shows the test positivity rate for all Covid samples taken, including those outside of hospitals, and is mapped against the UKHSA activity thresholds. The thresholds are based on the historical trend for Covid test positivity and, consequently, represent a relative risk. More details on this approach can be found in the Guide to Covid Surveillance Metrics.
The chart shows a slight increase in the test positivity rate but levels remain well below the baseline threshold of activity indicating relatively low levels of risk.
The following chart displays the test positivity rates for the main respiratory illnesses in England, covering Flu, Covid, RSV, and Rhinovirus. This positivity rate is only for tests carried out in hospital so differs slightly from the previous chart. However, taking this approach allows a fair comparison between the different viruses.
The Covid positivity rate has continued to stay stable and remains low this week, significantly lower than Flu. Although Flu rates remain moderately high they are continuing to fall. RSV rates are at very low levels, whereas rhinovirus rates are at a moderately high level.
The chances are that if you have Covid-like symptoms you are more likely to be suffering from flu or a cold than RSV or Covid.
The next chart in this section shows weekly hospital admissions per 100,000 people in England for the main respiratory diseases.
Over the past week, weekly hospital admission rates for Covid remained at very low levels . Meanwhile, admission rates for Flu are continuing to fall from their recent peak and are at moderately low levels. Admissions for RSV are stable and at low levels.
Finally, although press coverage about the risk of Human metapneumovirus (hMPV) has declined, UKHSA continue to report on its progress. The following chart shows the trend in the test positivity rate hMPV in hospital patients admitted with respiratory illness in England for the past two years.
Human metapneumovirus (hMPV), a virus with symptoms similar to Flu, is a seasonal virus that usually peaks in early January and then falls in February. This week test positivity decreased to 3.5% and it looks like the seasonal peak is over.
Scotland weekly hospital admissions and bed occupancy
Scotland continues to publish weekly data on hospital admissions and bed occupancy for Covid as well as wastewater monitoring data. The dashboard for Scotland’s data can be accessed here.
The following panel chart shows the most recent data for weekly Covid hospital admissions depicted in blue, together with the number of beds occupied by Covid patients, shown in orange. The number of occupied beds represent patients being treated for Covid as well as those being treated with Covid.
This week Covid admissions and beds occupied by Covid patients remained stable at very low levels.
Scotland remains the only home nation that is monitoring Covid levels using wastewater sampling and the following chart shows the seven day average of Covid levels found up to Mar 14, 2025.
The wastewater sampling data shows that the high Covid levels observed at the start of August have significantly dropped and are now at very low levels. This week the data showed Covid levels remained at their lowest ever detected.
Finally, the following chart compares the weekly hospital admissions for the main respiratory viruses in Scotland.
The chart shows that flu-related emergency hospital admissions rose sharply in December and Public Health Scotland reported that this reached a record high of 1606 admissions for the week ending Dec 29. This surge placed a considerable burden on hospitals. However, Flu admissions have fallen significantly in the past weeks and are now at relatively low levels.
Wales Covid hospital admissions.
Public Health Wales recently updated the published data on respiratory viruses, resulting in the currently available data being limited.
The following chart provides the trend for weekly hospital admissions in Wales.
Hospital admissions for Covid in Wales were stable this week and remain at low levels.
Status of main respiratory diseases in Northern Ireland.
Public Health Northern Ireland issues a combined surveillance report on influenza, respiratory syncytial virus (RSV), and COVID-19 to offer a comprehensive view of the epidemiology of these infections within Northern Ireland. The report, published every Wednesday, can be accessed here.
The first chart in this section shows the test positivity rates in Northern Ireland for the main respiratory illnesses — Flu, RSV, and Covid.
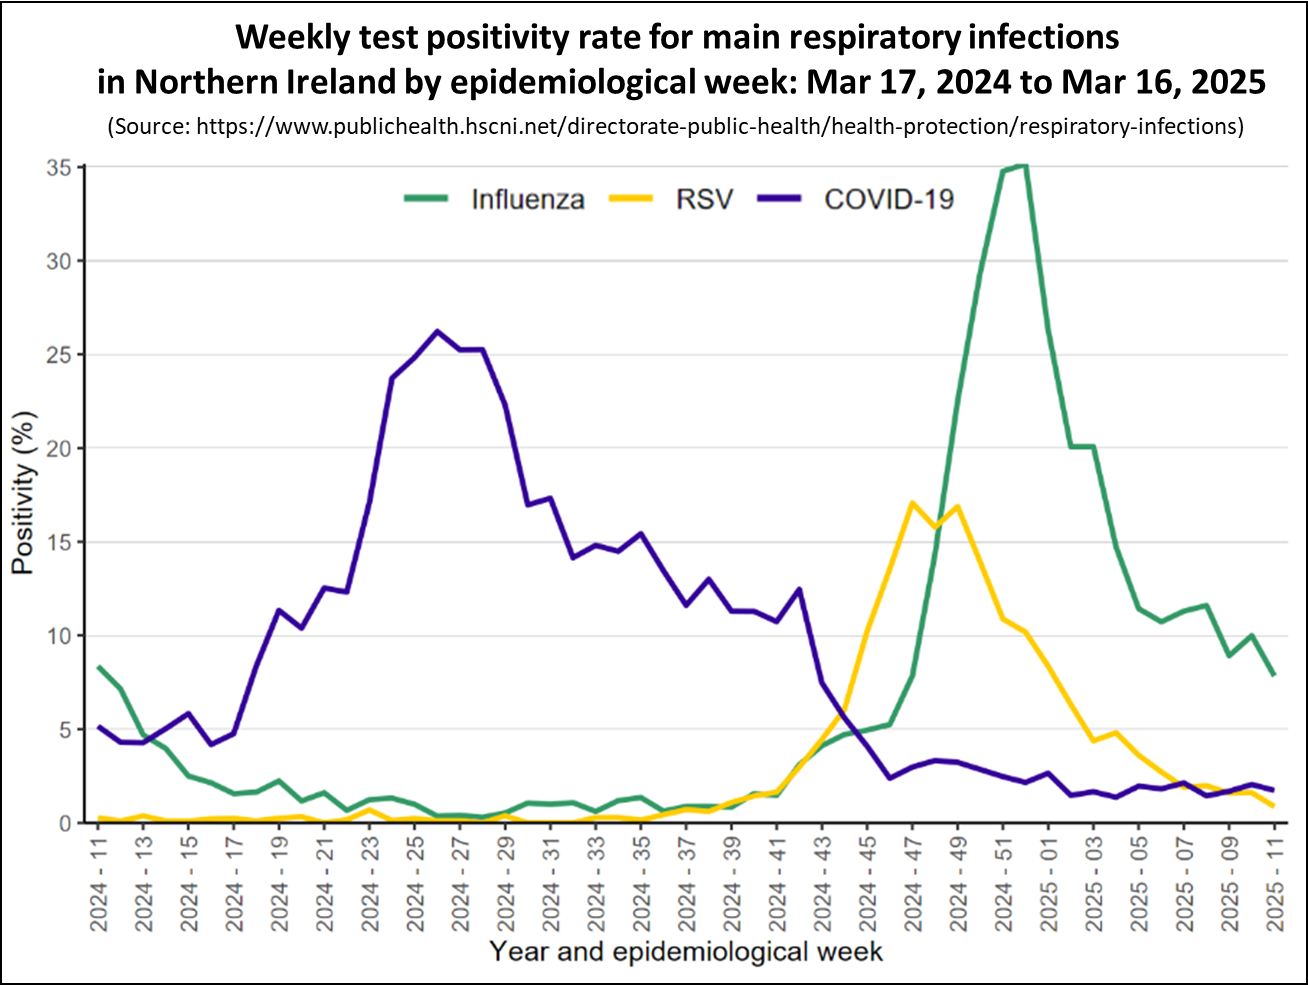
The chart shows that once again Covid levels, depicted in purple, have stayed stable this week and are at their lowest point in a year. Additionally, they continue to be lower than the rates of other major respiratory viruses. Positivity rates for Flu, shown in green, have continued to fall from the winter peak, but have now stabilised at moderately low levels.
The chart below presents the weekly count of hospital admissions for the main respiratory illnesses where the infection was contracted in the community, thereby excluding patients who contracted Covid while in hospital. It is important to note that the hospital admissions data for other home nations include patients who contracted infections in the hospital, making them not directly comparable to the data from Northern Ireland.

The chart shows that for most of 2024, the bulk of hospital admissions for respiratory infections stemmed from Covid. However, since November hospital admissions for Covid, indicated in purple, have have been low.
Meanwhile, hospital admissions for the Flu, depicted in blue, increased significantly in December. However, Flu admissions have fallen for the past five weeks and are now relatively low.
Long Covid Update
This week saw the publication of a study of data on Long Covid from the 2023 GP Patient Survey in England, a random sample of 759,149 patients aged 16 years and older registered with a GP in England. The annual GP Patient Survey is an independent survey run by Ipsos on behalf of NHS England. The results show how people feel about their GP practice and includes questions about their general health.
From 2022, a new question was added to the survey that asked whether respondents had Long Covid. The question added was “Would you describe yourself as having ‘Long Covid’, that is, you are still experiencing symptoms more than 12 weeks after you first had COVID‐19, that are not explained by something else?”. Respondents could reply ‘yes’, ‘no’, ‘not sure’ or ‘prefer not to say’. The following table shows the yearly trend for the percent of people responding ‘yes’ and ‘not sure’ when answering this question.
The percent of patients reporting they have had Long Covid has remained broadly unchanged and relatively high over the past three years. This is a high burden of disease with potential for significant impact on individuals and their families. These levels are consistent with other sources, including the Office of National Statistics data I covered in this article.
Moreover, there are more people who are unsure whether they have Long Covid than those who are confident they have it. The paper suggests several reasons for why people are unsure. Levels of uncertainty may indicate a lack of awareness of Long Covid symptoms or confusion, or there may be an overlap in symptoms with other conditions. People who are unsure may have less severe Long Covid symptoms, or may have symptoms that are improving or are currently in remission, and so are no longer sure if they still have Long Covid. Finally widespread stigma associated with Long Covid may prevent people from talking about it and seeking help.
The study recommends that further work is required to understand why people are unsure if they have Long Covid and calls for:
Improved awareness amongst the general population and healthcare professionals to ensure those most vulnerable in society are identified and provided with care and support.
The study also looked at patient characteristics associated with self-reported Long Covid and the rest of this section highlights some of those areas.
The following table gives the level of Long Covid reported by deprivation and shows that those living in the most deprived areas report the highest levels of Long Covid.
The study also looked at whether the reported Long Covid rate varied by age and found that adults of working age had the highest levels.
Those aged youngest (16 to 24 years old) and oldest (85+ years) were more likely to say that they were ‘not sure’ they had Long Covid (compared to those who answered ‘yes’ ) than those in the other age groups.
The final table shows how the self-reported Long Covid rate varied by work status.
Adults who are permanently sick or disabled report by far the highest level of Long Covid of any work status group.
In conclusion
Although the amount of data currently being published has decreased, the information available for England show that Covid levels are at relatively low levels and much lower than Flu or RSV.
Recent data indicates that Scotland, Wales and Northern Ireland also indicate low levels of Covid.
Across all home nations, Flu levels are falling fast and are now at relatively low levels. The Winter peak is over.
As always, if you have any comments on this Covid Situation Report or suggestions for topics to cover, please post a message below.
Appendix 1. Test positivity rates and prevalence
Positivity rates are derived from the results of hospital laboratory tests conducted on patients exhibiting symptoms of respiratory diseases. Test positivity is the percentage of patients who test positive for Covid of the total number of patients tested. Since the individuals tested for this measure are not a representative sample of the general population it differs from prevalence, which is derived from a representative sample of the population.
Test positivity rates, while not directly estimating the number of Covid infections in the general population, can be a valuable indicator of the infection trend. The panel chart below compares the weekly test positivity rate among hospital patients with respiratory symptoms to the prevalence of Covid in the general population, as reported in the Winter Infection Survey.
The chart shows that the weekly test positivity rates for patients with symptoms of respiratory infections follows the same pattern as the prevalence for Covid reported by the Winter Infection Survey. Since the Winter Infection Survey is based on a representative sample of the general population this supports using test positivity as a useful proxy for infection trends.
At this point, the latest SARS CoV 2 variants are probably not more severe compared to 229E which is the prototype human coronavirus. LP.8.1.1 is said to have quite weak lung entry ability.
Source:
https://x.com/LongDesertTrain/status/1894923514743865792
https://x.com/LongDesertTrain/status/1894923517155504324
Thank you for another great update. But the deep dive into long covid self perception in that large sample is extremely revealing. It confirms what I experience anecdotally from talking about my long covid experience with others. People don't tend to talk about any symptoms they have lingering post covid infection/s unless it comes up in conversation explicitly. Also, if people are not very physically active habitually they may not recognise how covid may have affected their physical capacity.