


Covid Situation Report: Mar 14, 2024
Update on Covid providing information on prevalence and hospital admissions for England and its regions. This post is best viewed using the browser or Substack app.

Introduction
This report is part of a weekly series that I will publish during the Winter 2023 / Spring 2024 season to provide an overview of the current Covid situation in England and its regions. I use a standard set of interactive charts to present the data. For those who want more detail I do a deeper dive on topics of interest each week. This week I take a detailed look at the latest data from the Winter Infection Survey for England and Scotland which includes important information in the Infection Hospitalisation Risk.
A Word on the Availability of Covid Data
I would like to begin this report by letting you know of some imminent changes to the data availability that impacts this report's production. Unfortunately, certain data previously included will stop being published, while other data will be reported less frequently.
This week marks the publication of the final data from this year's Winter Infection Survey. Also, from April 4, the publication frequency of the data on daily admissions and bed occupancy will move from weekly to monthly. A revised schedule for publishing weekly data on the primary respiratory viruses has not been confirmed yet. However, last year, the frequency changed to biweekly starting in April.
Clearly these changes will affect this weekly Covid Situation Report and I will let you know more when the details become clearer.
Summary
This week's news remains upbeat, with all Covid metrics in both England and Scotland indicating that the winter surge has ended.
The Winter Infection Survey estimated that for the week ending March 6, there was an infection rate of only 1 in 143 people with Covid in England, and just 1 in 167 in Scotland.
The risk of hospitalisation for those infected rises markedly with age, with individuals 75 and older having a 1 in 30 chance of being admitted to the hospital upon infection.
Over the past two weeks, the prevalence of Covid in England and Scotland has fallen slightly across all age groups, with the highest rates observed in the youngest school-aged group. Additionally, every region in England has seen a fall in prevalence levels.
The positivity rate for Flu continued to fall this week whilst the rate for Covid remained broadly unchanged.
Weekly hospital admission rates to hospitals for Covid and Flu remained largely stable and at low levels. Admissions for Flu continue to be higher than for Covid.
The latest daily Covid hospital admissions and number of occupied beds also saw large falls confirming the trend seen in the other metrics.
A final reminder from Professor Steven Riley, Director General for Data and Surveillance at UKHSA , that:
When we have symptoms of a respiratory illness like COVID-19, we should do our best to limit our contact with other people, especially those who are more at risk. This will help to keep rates low and protect ourselves and those around us.
Winter Covid Infection Study
On March 14, UKHSA published the latest and final results from the ONS Winter Infection Study. This is the last report for the 2023/24 survey season.
As well as reporting on the prevalence of Covid in England and Scotland, this weeks report also provided important information on the Infection Hospitalisation Risk (IHR). This measures the risk of hospital admission given that an individual has been infected with the Covid.
It is important to note that the IHR represents an average risk for the average person in a subgroup at a population level, individual risk will vary due to co-morbidities and other factors.
The following chart shows the Infection Hospitalisation Risk by age for England based on data from the Winter Infection Survey and NHS England hospital admissions.
It is very clear that the risk of hospitalisation for infected individuals increases significantly with age. Individuals aged 75 and older face a 1 in 30 probability of hospital admission upon infection, while those between 6 to 17 years old have only a 1 in 3,930 chance.
Covid Prevalence in England and Scotland
In this weeks report, UKSHA published the estimated prevalence of Covid for England and Scotland, together with the prevalence by region and age group. It is important to note that prevalence is different from the positivity rate.
Prevalence is the estimated proportion, expressed as a percentage, of all individuals within the reported group who are infected with the the Covid virus at a given point in time. Importantly, prevalence adjusts for the age profile of the sample of people responding to the survey being different from the age profile of the general population. It is different from the positivity rate which is simply the percent of people testing positive and takes no account of the age profile of those tested.
The key finding from this weeks Winter Infection Survey is that the prevalence of Covid in England and Scotland remained broadly stable over the 2 weeks leading up to Mar 6, 2024.
The following chart shows the trend in prevalence of Covid for England from Nov 14, 2023 to Mar 6, 2024.
The prevalence of Covid-19 in England has remained stable over the past week. As of March 6, 2024, it stood at 0.7%, equating to approximately 388,000 individuals infected. This rate suggests that 1 in every 143 people was infected, a significant improvement from two weeks ago when the estimate was 1 in 111. The current prevalence in England is considerably lower than the level observed at the beginning of the survey, which was 1.4%. While direct comparisons are challenging, the prevalence for the week ending March 6, 2023, was higher at 2.4% and on an upward trend.
Turning now to prevalence in Scotland which is shown on the next chart.
The prevalence of Covid in Scotland remained relatively unchanged in the latest week at 0.7%, significantly lower than the 1.2% observed at the beginning of the survey. It is estimated that 1 in 167 people were infected, amounting to approximately 30,000 individuals, an improvement from the 1 in 143 people reported a fortnight prior.
The following panel chart shows the trend in prevalence by age group for England and Scotland. For reference, the ‘All Ages’ trend is shown as a grey line in each age group’s panel. The values for each age group can be viewed by moving the cursor over any trend line.
Across England and Scotland prevalence continued to fall across all age groups. However, it is highest for those who are school aged (3 to 17 year olds) and they are now the only group where prevalence is not lower than at the start of the survey. Prevalence remains lowest for those 65 years and older.
The next panel chart shows the trend for prevalence by region. The grey trend lines in each panel show the other regions for comparison. Again the values for each region can be viewed by moving the cursor over any trend line.
The prevalence of Covid has decreased across all English regions compared to two weeks ago and remained stable over the most recent week. It is currently lower in every region than when the survey started.
The final chart in this section compares the trend of prevalence with the waste water surveillance data for Scotland. The blue line plots prevalence and the red bars the Covid levels detected in waste water samples taken from across Scotland.
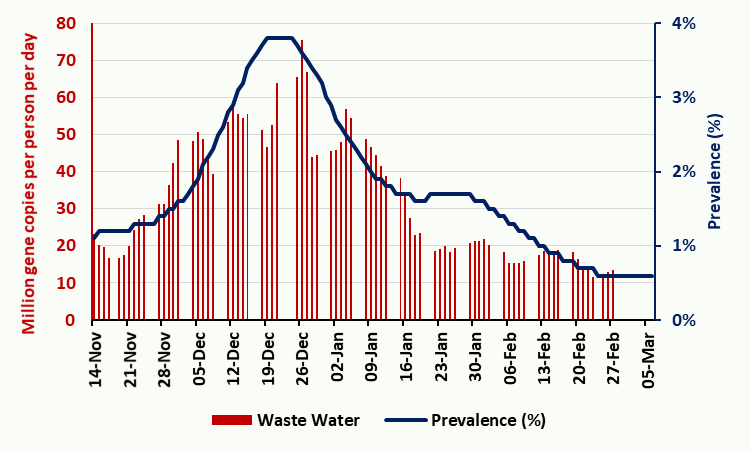
Although the wastewater data is noisy, it follows the same general pattern of prevalence observed in the Winter Infection Study. This indicates that wastewater surveillance for Covid serves as a reliable proxy for determining Covid prevalence. Regrettably, Scotland remains the only home nation that continues to operate a wastewater surveillance program.
Status of main respiratory diseases in England
The following chart shows the positivity rates for the main respiratory diseases in England which are Flu, Covid, RSV and Rhinovirus.
The positivity rate for Flu continued to fall this week and was down to 4.8% this week; however, the rates for Covid and the other respiratory viruses remained broadly unchanged.
The following chart shows hospital admissions per 100,000 people in England for the main respiratory diseases.
The weekly admission rates to hospitals for all major respiratory viruses have remained largely stable and at relatively low levels.
Once again, the positivity rate and weekly hospital admissions for Flu remained higher than for Covid. The chances are that if you are showing Covid-like symptoms you are more likely to have Flu than Covid.
Covid hospital admissions and bed occupancy
This section looks in more detail at the latest daily data on Covid for hospitals in England. When reviewing the following dashboards, it is important to consider that as the absolute numbers decrease, the weekly percentage change in the data may seem disproportionately large.
The following dashboard of key Covid metrics saw daily hospital admissions increase very slightly whilst beds occupied by Covid patients continued to fall.
The next dashboard gives the Covid hospital admissions per 100,000 by region.
The hospital admission rates for most regions remained largely stable. However, there was an increase in the South West and North East Yorkshire regions, albeit from relatively low figures. Once again, the daily hospital admissions for Covid are in line with all the data presented in previous sections.
In conclusion
This week's Winter Infection Survey indicates that the prevalence of Covid in England and Scotland remains broadly stable and at relatively low levels across all ages and regions.
The data for daily and weekly Covid hospital admissions in England remain low and stable, which aligns with the pattern for prevalence.
Hospital admissions for Flu remain higher than for Covid.
As always, if you have any comments on this Covid Situation Report or have suggestions for topics to cover then please post a message below.
“Across England and Scotland prevalence continued to fall across all age groups. However, it is highest for those who are school aged (3 to 17 year olds) and they are now the only group where prevalence is not lower than at the start of the survey.” This is worrying - we should be doing our utmost to protect our children, especially from repeated infections. We need much better mitigations in schools - proper HEPA ventilation systems would be a good start.
On the graph showing Scottish wastewater and Covid prevalence (presumably Scotland) can the prevalence for England and Wales be also displayed for the same time period. It will be interesting to see if the E&W prevalence correlates with Scottish prevalence and therefore Scottish wastewater data. Reason: therefore Scottish wastewater data could via a formula act as a proxy for all GB nations all year round; in the absence of the other surveys?