

Covid Situation Report: Sep 19, 2024
Covid Situation Report: Sep 19, 2024
Update on Covid providing information on prevalence and hospital admissions for England and its regions. This post is best viewed using the browser or Substack app.

Introduction.
This report is part of a weekly series that summarises the Covid situation in England and its regions.
A reminder that not all of the data previously included in the situation update is now available on a weekly basis. Where relevant, changes to the content and data sources have been noted.
This week the data published for England is very limited and only covers case rates from the UKHSA Covid dashboard. The latest available data for Scotland, Wales and Northern Ireland is also covered, together with wastewater data from Germany and Denmark. Finally, there is a short update on Covid deaths in England and Wales.
Summary.
This week's limited data indicates that Covid levels have stopped falling and seem to have stabilized, although at a higher level than before the recent 'summer' surges.
Although last week's early indications of rising levels in England, Scotland, and Wales have not materialised, the identification of the XEC Covid variant in the UK, which possesses a growth advantage over current variants, indicates a potential resurgence of cases as winter approaches.
Covid case rates in England have stopped falling and are broadly stable at levels close to those seen in March/April ahead of the summer surge.
In Scotland, hospital admissions and the number of beds occupied by Covid patients have stopped falling and stabilised but at levels higher than earlier in the year.
In Wales, the decrease in Covid cases and hospital admissions has also come to an end but there are some early indications of rising levels.
In Northern Ireland hospital admissions for community-acquired Covid in have stopped falling from the latest peak and have stabilised, albeit at higher levels than before the onset of the recent surge.
Covid levels detected in wastewater in Germany and Denmark are stable indicating that we have yet to see the impact of the new XEC variant in Europe.
Finally, deaths due to Covid in England and Wales this year are will below those seen in the previous year. In the past weeks, deaths have continued to decline consistent with the fall in hospital admissions following the summer surge.
This is an important reminder that Covid is not presently a seasonal disease and may never become one. As such, we should anticipate potential future waves with the emergence of new variants, like XEC, and as immunity levels diminish.
With that in mind, the NHS have reconfirmed eligibility criteria for the Autumn 2024 booster campaign which will start on October 3, 2024. Bookings will be open to the public from next Monday, September 23, 2024. Eligibility can be confirmed and bookings made at the following link.
As always, it’s important to remember that the risk of hospitalisation from Covid infection increases significantly with age and for those immunocompromised. Also Long Covid remains a risk for all as shown by the recent ONS report. Therefore, it is prudent to take appropriate measures such as self-isolating when experiencing Covid symptoms and enhancing ventilation or wearing masks whenever possible.
Status of main respiratory diseases in England.
The UKHSA National influenza and COVID-19 surveillance report has moved to a condensed summer report and is now released every two weeks. Consequently, there is no updated information on Covid test positivity or weekly hospital admissions available to report. The next update will be published on Thursday, Sep 26 2024.
Covid case rates in England
The UKHSA Covid dashboard continues to publish daily case rates for England on a weekly basis. As the majority of testing now occurs in hospitals or under medical supervision, these rates should closely align with hospital admissions. However, a comparison of daily case rates and daily admissions shows that this is not the case.
Appendix 1 indicates that although Covid case rates typically reflect the pattern of hospital admissions, there is a notable discrepancy in the magnitude of changes, with admissions experiencing a more pronounced fluctuation than case rates. Therefore, while case rates are helpful in signalling the general trend of Covid within the population, they do not precisely represent the degree of change.
The first chart in this section shows daily case rate per 100,000 individuals.
The chart indicates that Covid case rates have stopped falling and are broadly stable at levels close to those seen in March/April ahead of the summer surge. It is important to note, as detailed above and in Appendix 1, that comparisons with the peak in Winter 2023 are not recommended.
The next panel chart in this section shows Covid rates for the regions of England. Hover your cursor over one of the chart lines to display the admission rates for all regions.
The panel charts show that after the recent downturn, daily case rates are now levelling off at lower figures in most areas. The initial indications of a rise in the North East and Yorkshire and Humberside regions, noted in last week's report, have not yet resulted in an increase in those areas.
Daily Covid hospital admissions and bed occupancy.
This section gives a more detailed examination of the most recent daily Covid data for hospitals in England.
NHS England stopped the weekly publication of data used to create these dashboards from April 4, 2024 and have moved to a monthly publication schedule. The next update will be available on October 10, 2024 covering September data.
Scotland weekly hospital admissions and bed occupancy
Scotland continues to publish weekly data on hospital admissions and bed occupancy for Covid as well as waste water monitoring data. The dashboard for Scotland’s data can be accessed here.
The following panel chart shows the most recent data for weekly Covid hospital admissions up to Sep 8, depicted in blue, together with the number of beds occupied by Covid patients up to Sep 15, shown in orange. The number of occupied beds represent patients being treated for Covid as well as those being treated with Covid.
The charts shows that the recent 'summer' Covid wave in Scotland led to more hospital admissions and a greater number of beds occupied by Covid patients compared to the 'winter' wave. This contrasts with England, where 'summer' hospital admissions did not surpass those seen in 'winter'.
The recent fall in weekly Covid admissions and bed occupancy for Scotland has now stopped and has stabilised at higher levels than earlier in the year.
Scotland remains the only home nation that is monitoring Covid levels using wastewater sampling. However, wastewater data reporting is currently paused until the end of September as the responsibility for laboratory Covid water samples testing transfers from Scottish Environment Protection Agency (SEPA) to NHS Lothian.
Wales Covid cases and hospital admissions.
Public Health Wales publishes a weekly Covid dashboard, presenting key Covid hospital indicators for the preceding 90 days. This dashboard can be found here. Additionally, data regarding Covid cases detected through testing in hospitals and other medical facilities are released every week.
The following chart shows the latest data for the weekly (7 day rolling sum) number of cases reported.
The summer wave of cases in Wales exceeded the 'winter' wave, culminating in the highest level in more than a year. Although this surge is over, the recent fall in Covid cases in Wales has stopped at a level higher than before the summer peaks. Whilst the latest weeks data is ‘noisy’, making it difficult to interpret. there may be some early signs that cases are starting to rise.
The following chart gives the trend for weekly hospital admissions in Wales.
Hospital admissions for Covid in Wales have significantly decreased from the 'summer' peak, but the fall has stopped, and the numbers have now stabilised at a level higher than before the recent surges.
Northern Ireland hospital admissions
Public Health Northern Ireland publishes a weekly COVID-19 Epidemiological Bulletin that provides data on Covid cases, hospital admissions and occupancy and care home incidents. The full report, published every Thursday, can be found here.
The chart below presents the weekly count of Covid hospital admissions for cases where the infection was contracted in the community, thereby excluding patients who contracted Covid while in hospital. It is important to note that the hospital admissions data for other home nations include patients who contracted infections in the hospital, making them not directly comparable to the data from Northern Ireland.
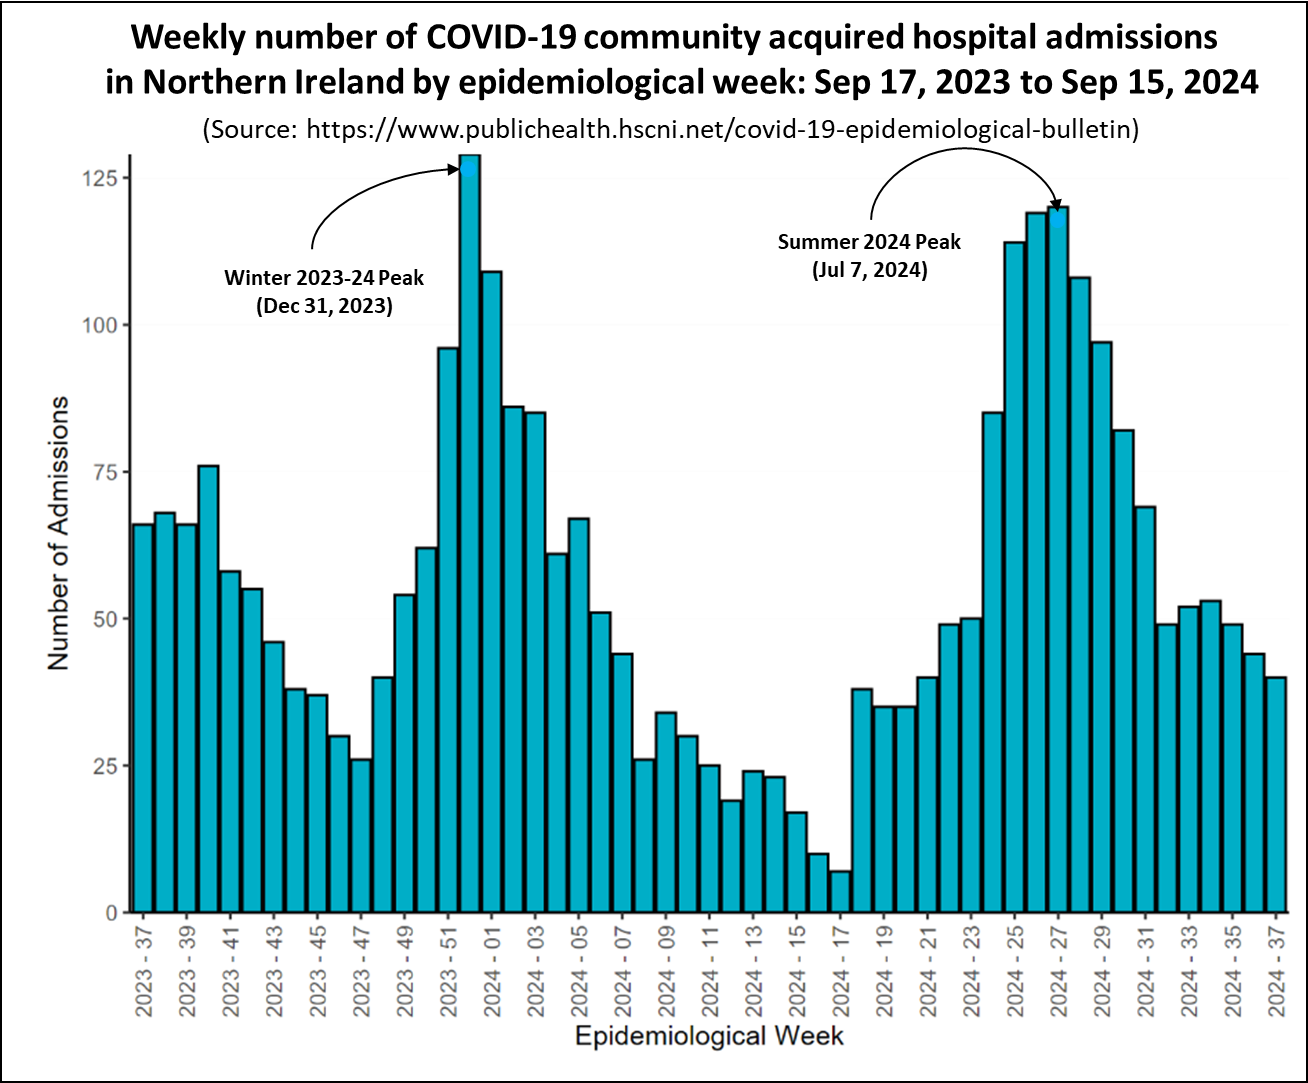
The chart shows a similar pattern to that seen in Scotland Wales, with the 'summer' wave's peak nearly reaching the heights of the 'winter' wave. Since that time, the number of admissions has decreased and stabilized at a rate higher than prior to the onset of the recent wave.
This week's COVID-19 Epidemiological Bulletin remarks on the XEC variant, noting that it has not yet been detected in the Covid samples tested in Northern Ireland.
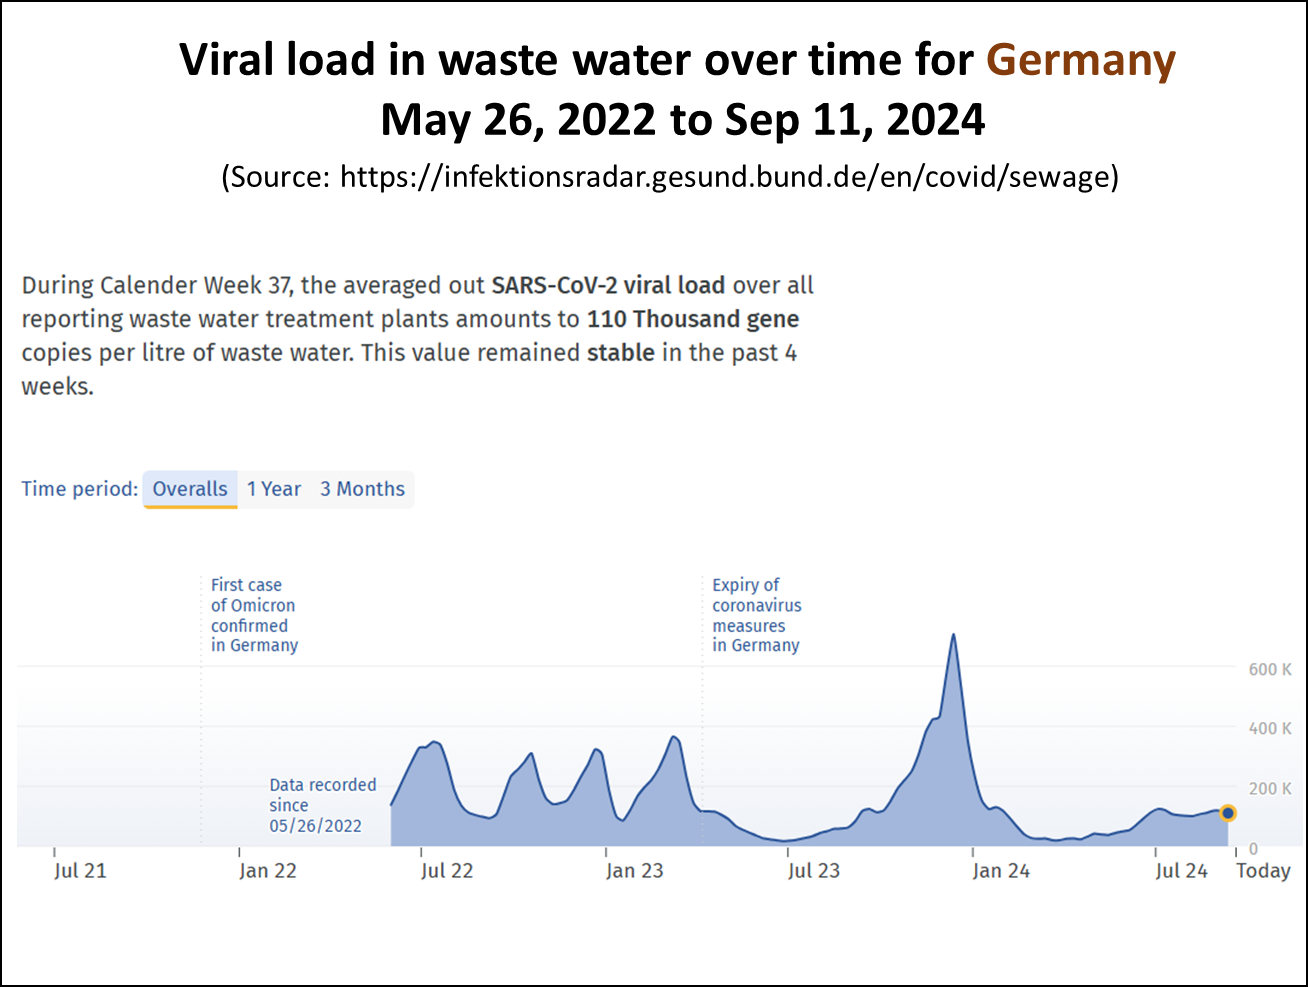
Covid levels in other countries
Wastewater monitoring is a valuable, complementary, independent, and objective approach to the surveillance and testing public health relevant pathogens like Covid. The EU Wastewater Observatory for Public Health website provides links to a number of national dashboards that publish detected Covid levels in wastewater. The website can be found here.
While not all national wastewater dashboards are user-friendly, they do offer insights into Covid levels across Europe. In general, the dashboards are not showing any significant rise in viral levels in wastewater.
As an example, the following image captures the latest data from the German wastewater monitoring website showing that Covid levels have remained stable for the past four weeks.
A further example, taken from the Danish wastewater monitoring website, also shows that detected Covid levels are stable, corresponding to a ‘no growth’ status.
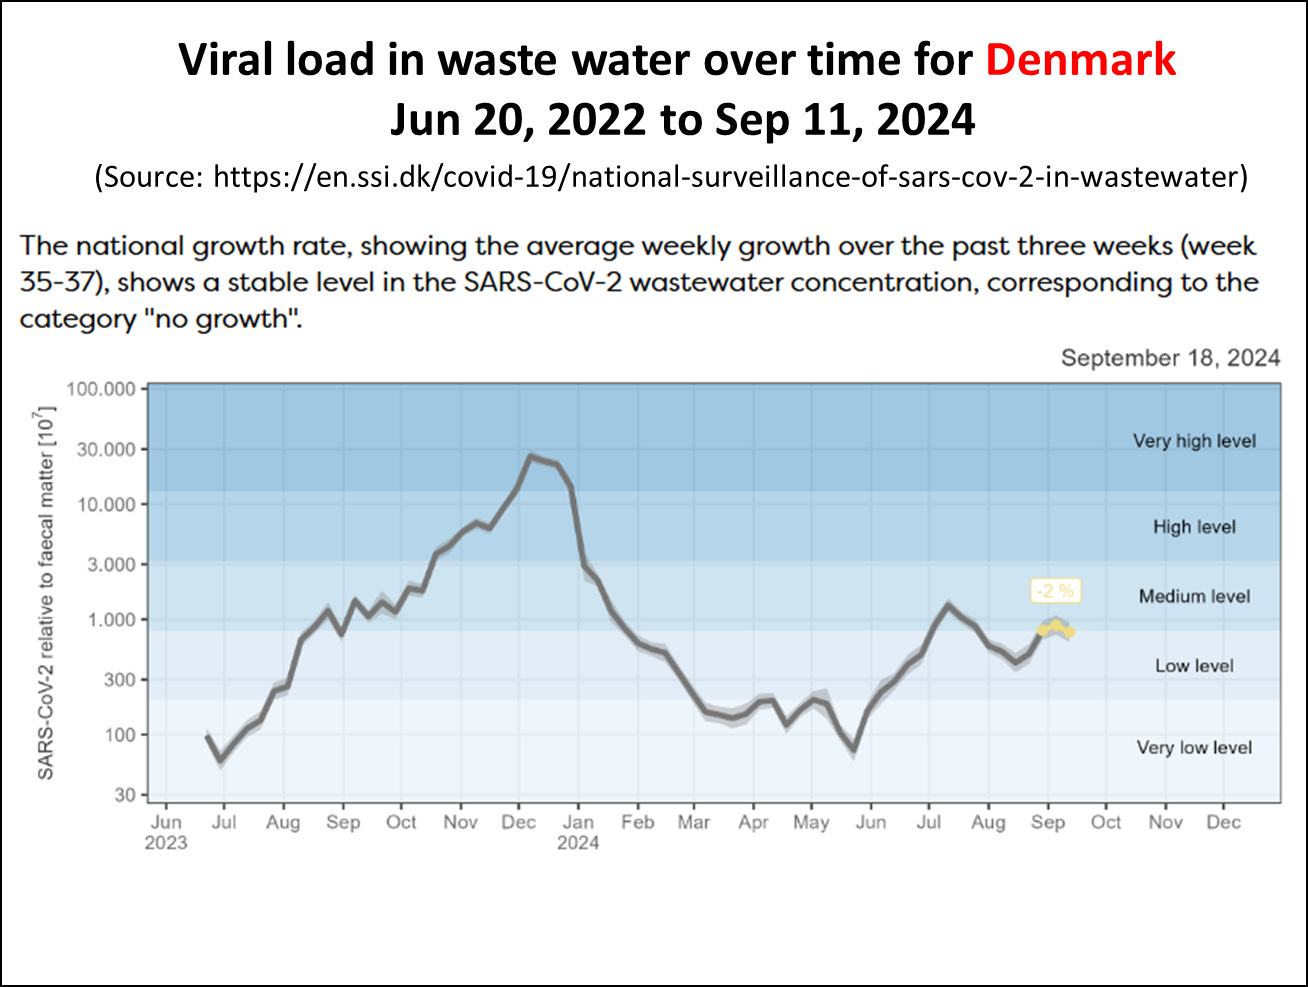
This would suggest that we have yet to see the impact of the new XEC variant across Europe.
Covid Deaths in England and Wales
The Office of National Statistics (ONS) publishes weekly reports on the number of deaths recorded on death certificates that are due to Covid or where Covid was involved. The data available is for both England and Wales.
The following chart presents a comparison of weekly registered Covid-related deaths in England and Wales for 2023-24, illustrated with the red line, against those of the preceding 12 months, shown with a blue line. The light blue shaded area indicates when deaths this year were lower than the preceding 12 months and the light red shaded area when they were higher. It excludes cases where Covid was mentioned as a contributing factor on the death certificate.
The chart indicates that latest deaths due to Covid in England and Wales have continued to fall from the recent summer peak and they are now lower than the figures reported for the same period a year ago.
Overall the weekly death toll due to Covid in 2023/24 has seen a substantial decrease from the previous year. In the 12 months leading up to Sep 6, 2024, there were 6,862 deaths reported, compared to 12,679 deaths in the previous 12-month period — a 46% reduction.
In conclusion
Although the amount of data currently being published has decreased, the limited information available for England show that Covid levels are now stable after the fall from the summer peak.
Data from Scotland, Wales, and Northern Ireland indicate that the recent 'summer' wave of Covid-19 had higher infection levels than the 'winter' wave. While levels have decreased since the summer peak, there are early indications that they are on the rise in Wales, while remaining stable in Scotland and Northern Ireland.
Covid levels detected in wastewater levels in German and Denmark are also stable indicating that we have yet to see the impact of the new XEC Covid variant across Europe.
Lastly, bookings for the Autumn 2024 booster vaccinations will open on Monday, September 23 and the campaign will start the following week.
As always, if you have any comments on this Covid Situation Report or suggestions for topics to cover, please post a message below.
Appendix 1. How reliable are Daily Covid Case Rates?
The UKHSA Covid dashboard continues to publish daily case rates for England on a weekly basis. As the majority of testing now occurs in hospitals or under medical supervision, these rates should be closely aligned with hospital admissions and the positivity rate of tests.
The first panel chart in this section tests that assumption by comparing the daily case rate per 100,000 individuals, shown in red, with daily hospital admissions for Covid reported by NHS England, depicted in blue.
The chart shows that while Covid case rates generally mirror the pattern of Covid hospital admissions, there is a significant disparity in the scale of changes. The grey shaded areas on each chart highlights the difference between the peak of the winter wave and the recent peak in June. Case rates experienced a 64% decrease, whereas hospital admissions saw a reduction of only 32% between the winter and June peaks.
In conclusion, although case rates are useful for indicating the overall trend of Covid in the population, they do not accurately reflect the extent of change. The likely reason for this is that testing levels have decreased by about a half since January.
Please could you confirm you intended to write that XEC is a more virulent strain? I understand there is an expected transmission advantage but is it known or theorised that XEC will be or is more virulent which I thought meant caused more harm to the host (is more severe)?
Thanks, as always Bob.
Do you have (or know where to find) information on which vaccine(s) will be offered by NHS, and which vaccines are currently being offered privately? What I'm interested in is whether private jabs are more "current" than the reported outdated stock being used by NHS?